

You can visit the
complete PDF version
of this document or
an abbreviated version also in PDF.
Cardprofit is an analytics and recommendation application
designed to increase credit card profitability and opportunity discovery for Issuer and
Acquirer portfolios.
CardProfit is an analytics, business intelligence
and strategic recomendation application for the integral administration of payments
portfolios. It is used to increase profitability and opportunity discovery in Issuer
portfolios in multi-dimensional cross-segmented
markets, and to derive unit indicators and profitability benchmarks in order to support
profitability and performance goal setting, valuation and monitoring. It is also used to
promote portfolio product development and performance and facilitate studies of tendencies
and life cycle issues. There is no similar or remotely comparable technology in the market
today, because analytics without profitability extraction and optimization will not address
the customers' bottom line. The CardProfit architecture is highly scalable and is designed
to run in the cloud under elastic servers with massive storage and processing capacity.
With CardProfit, bank-specific market segmentations can be created. For example, the Issuer
business can be segmented by product, brand, product type, geographical regions, cardholder
activity, credit limit usage, consumption volume, etc. CardProfit proposes a paradigm shift
to a competitive emphasis where segmentations can be profiled in terms of unit indicators
so that their performance can be isolated, compared and new opportunities identified. In
particular, cross or intersected segmentations are essencial to the understanding of the roles
played by intersecting, independent market factors in opportunity discovery. For Issuer this
leads to the discovery of opportunities and the realignment, redistribution and redesign of
the product portfolio and cardholder populations based on transactional frequencies, balance
and credit limit usage, etc., all resulting in increases in product performance and profitability.
The CardProfit profitability methodology has been applied extensively and has resulted in
profitability increases between 25% and 50%.
Each variable or unit indicator in the Issuer (or Acquirer) model can be visualized historically
and through time periods of any duration. Notice that the values shown in the following examples
are not realistic because the data has been generated randomly.
1 Issuer
1.1 Increasing Profitability with Benchmarks and Goals
It is not possible to optimize profitability without creating a profitability separation between segments and
between value sources. Without profitabiity unit indicators, it is not possible to compare segments or
their value sources. Unit indicator benchmarks offer a frame of reference
with which to make decisions towards profitability goal setting. External
unit benchmarks, when available, are beneficial but their use limited to average comparisons and not to
profitability optimization. It is considered necessary then for a bank to have the ability to automatically
generate a wide variety or catalog of internal unit benchmarks in order to properly characterize the range and
behavior of the bank's very own business experience.
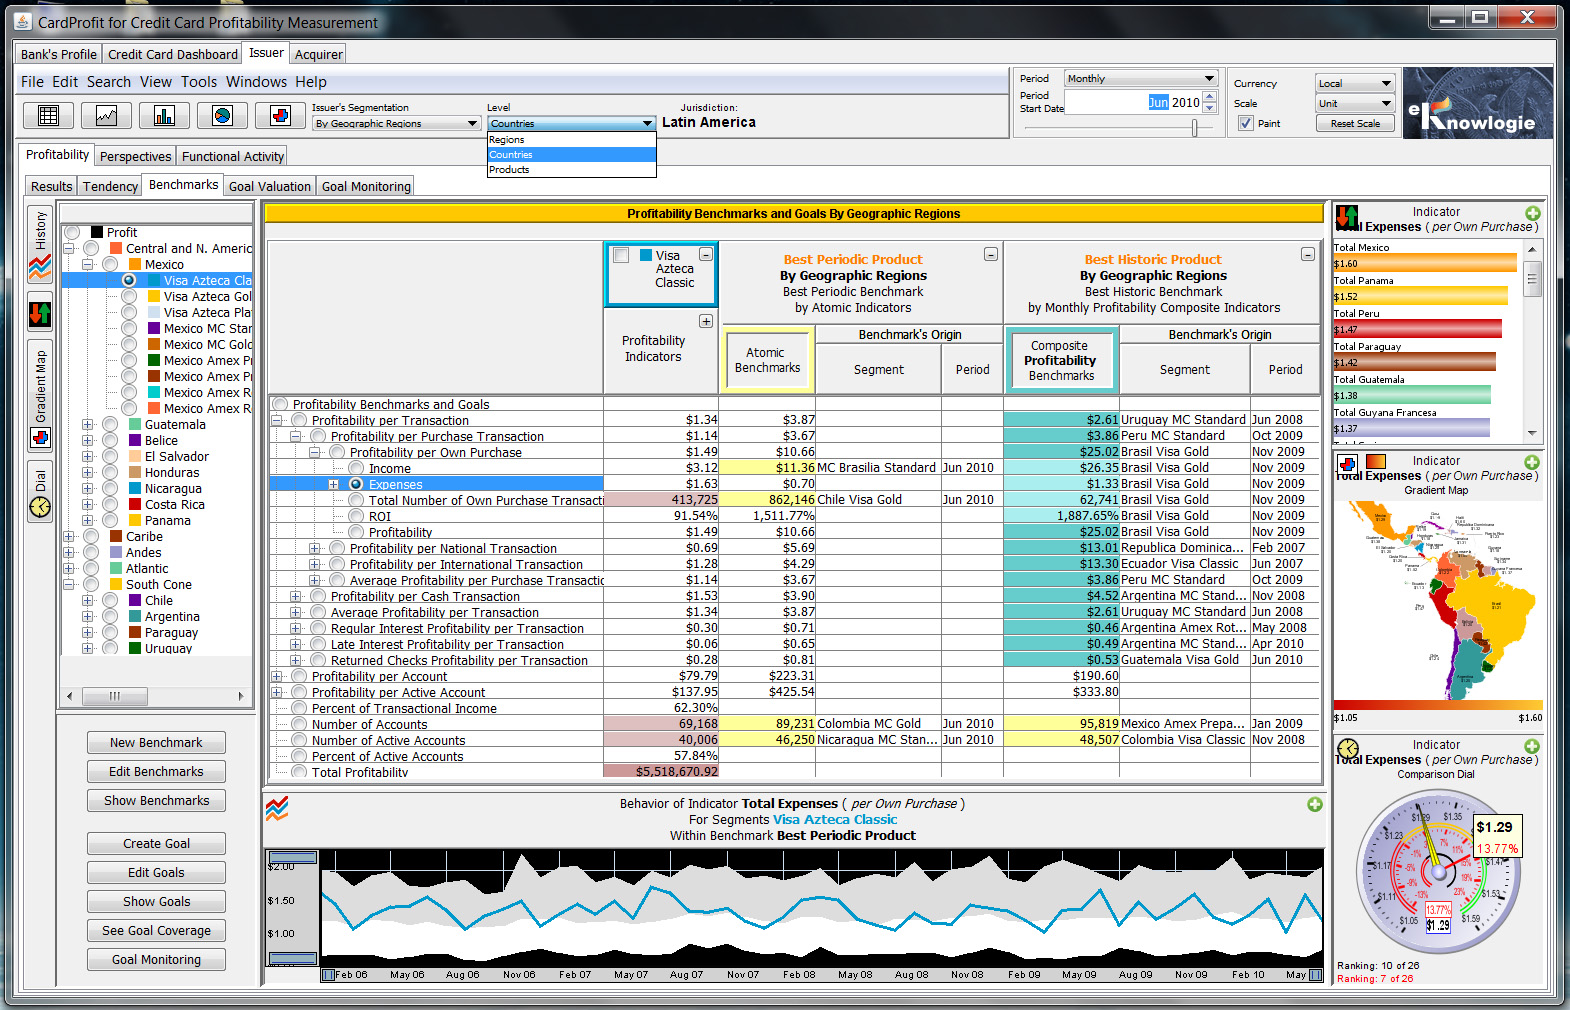
Creation of Unit Benchmarks
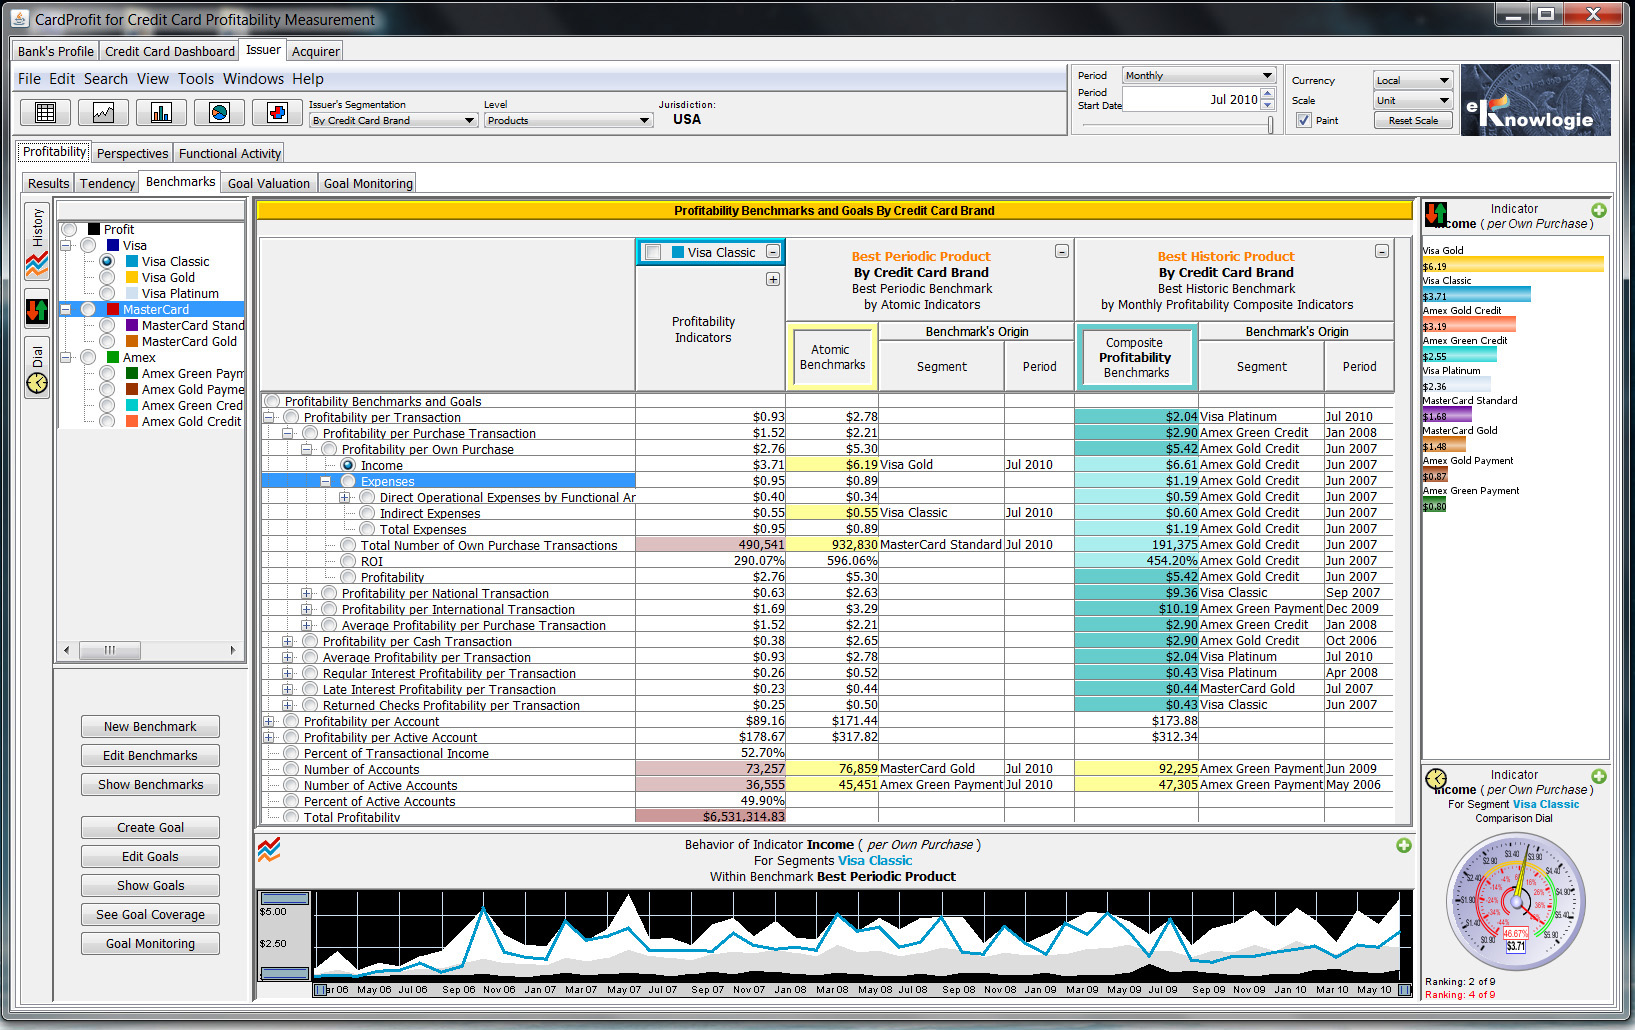
The next example shows profitability unit indicators for segment Visa Classic, located within a simple
brand hierarchy. Such panel also shows two of the benchmarks in the bank's catalog, which place Visa Classic
within a frame of reference. The composite indicator benchmarks shown in the table simply refer to indicators
derived from others, such as profitability indicators wich are produced from income minus cost indicators. Any
of the indicators shown in the main table rows can be studied in depth at the hierarchy level selected in the
tool bar. This hierarchy is very simple, with only two levels, Brands and Products, but other
hierarchies may additionally include geographical regions, countries, and newly acquired bank subsidiaries. The
selected Income per Own Purchase indicator is shown in a line chart against a benchmark and in additional bar and dial
chart comparisons with other segments in the level Products. Notice that the values shown in the
following examples are not realistic because the data has been generated randomly.
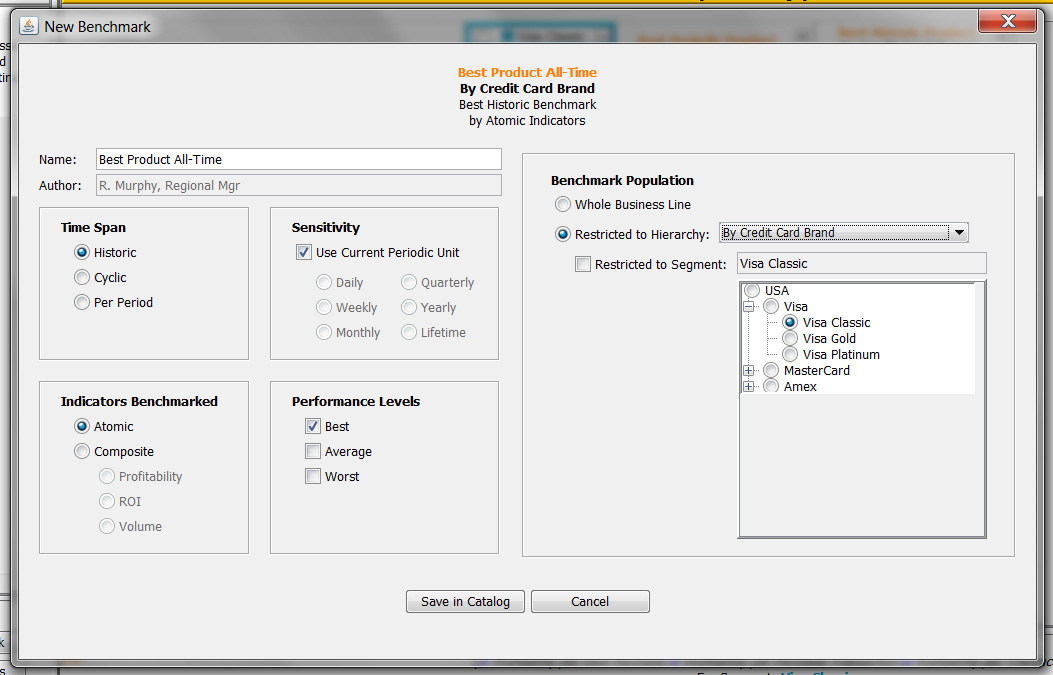
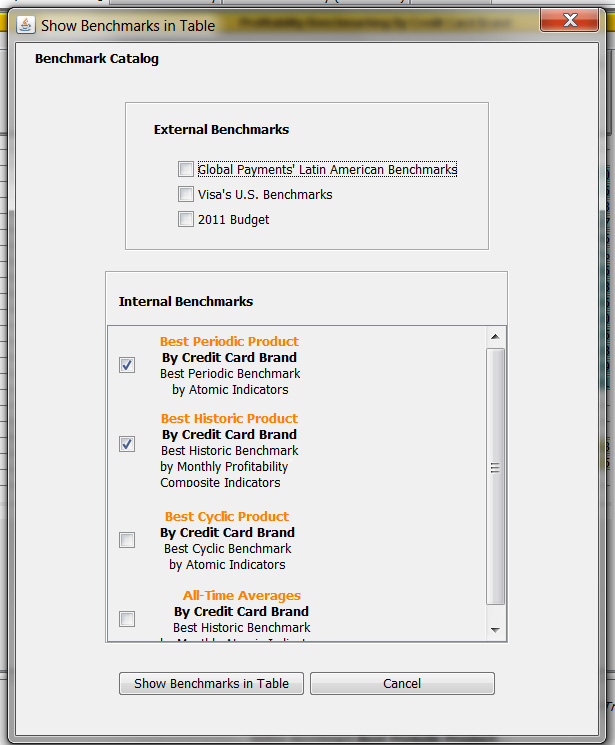
These two panels in the next example show how benchmarks can be created, stored in the bank's catalog,
and visualized in tables and charts, as shown in the previous example. Notice that budgets are also
considered benchmarks.
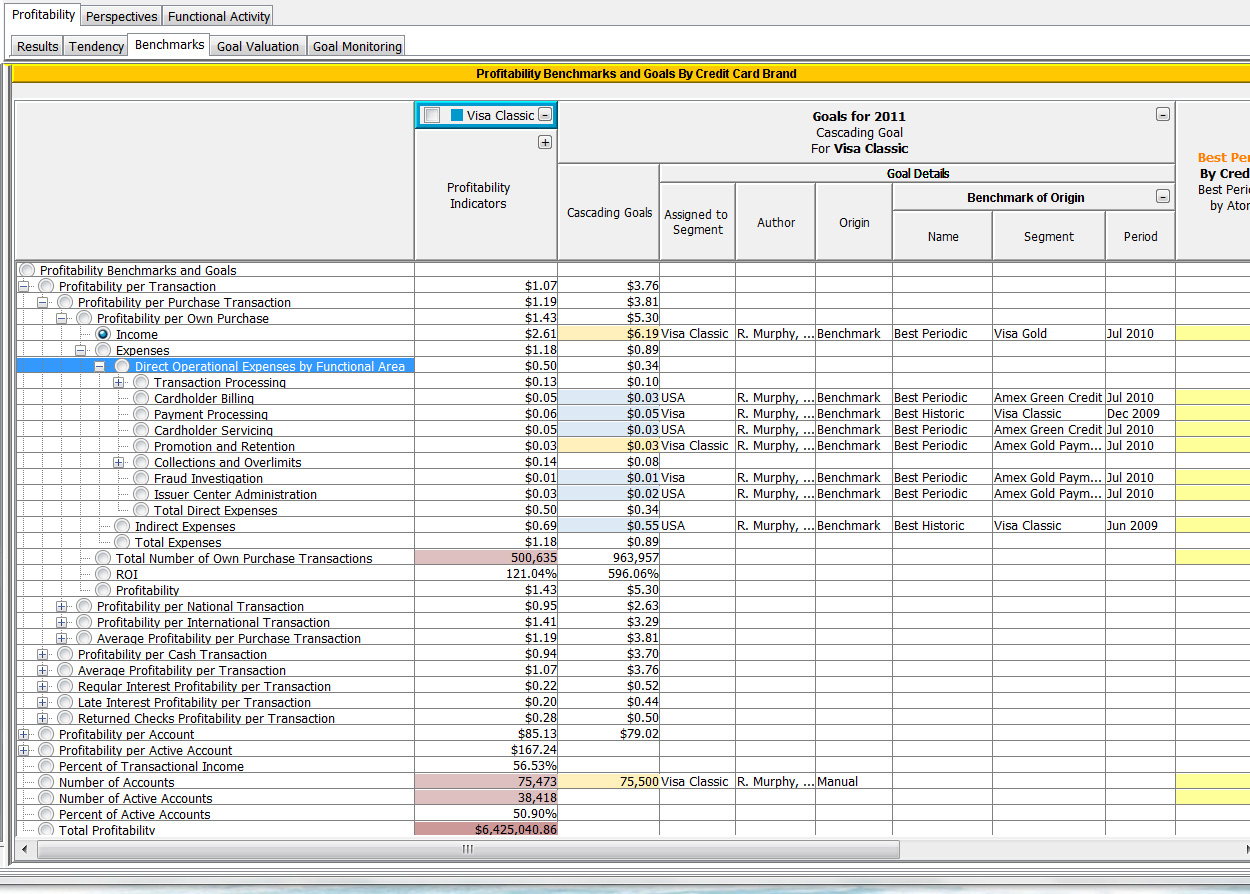
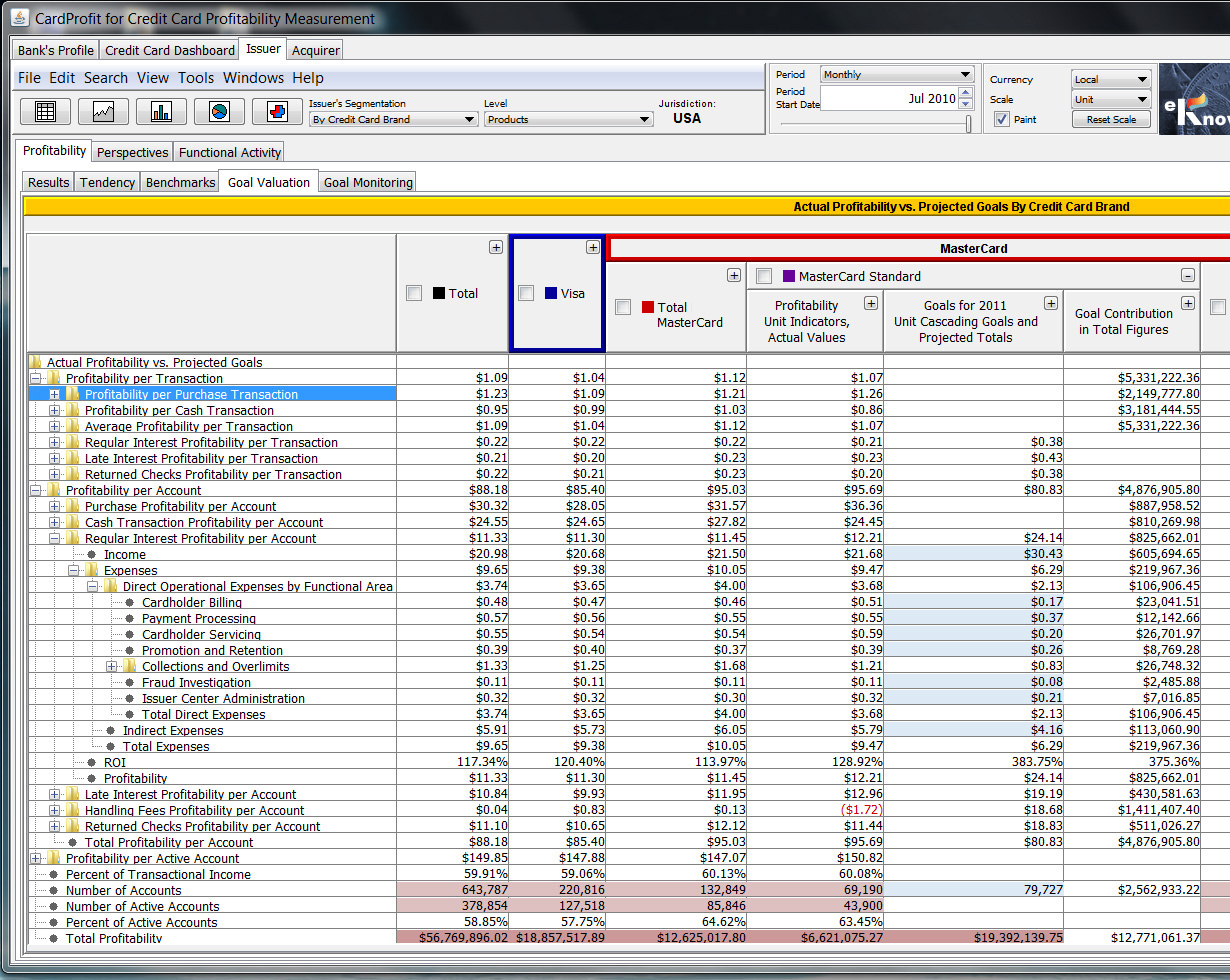
Cascade Goals Setting and Partial Coverage
The next step consists of the establishment of cascading goals for the Issuer business. In the table below
we can see an example of such goal setting. Notice that of all the goals applicable to Visa Classic,
some goals were inherited in cascade from its enclosing group segments, the Visa brand group and the
business root USA (show in light blue), while other goals were assigned specifically to
this segment, Visa Classic (in light orange). We can also observe that some goals come directly from
benchmarks in the catalog, while others (such as Number of Accounts) were created manually. CardProfit
is most flexible in that it is not necessary to "cover" all unit indicators with goals, nor all segments in the
hierarchy. We could for example, establish goals only for processing expenses per transaction, and leave the rest
of the indicators, such as incoming interchange income, regular interest income, other costs, number of transactions
per account, etc., uncovered (without goals). Likewise, "group goals", such as processing expenses per transaction,
can be used to cover more detailed goals, such as processing expenses per own, national and international
transactions. CardProfit was designed to offer full goal valuation and monitoring functionality of partially
covering goals.
Goal Valuation
Once created, these unit goals must be valuated in such a way that for each unit goal we can obtain the total
monetary increase that such goal will represent for each segment to which it was assigned, or conversely,
the total monetary increase of all goals assigned to each segment or segment group. So for example, if we assign
a goal to the unit indicator Processing Expenses per Own Purchase Transaction for a segment representing
an entire geographical region in a multi-national bank (perhaps because we have established that such transaction processing
must from now on be guided by the same standards), we will be able to immediately see the total monetary impact
of such a goal for each product, country and the region as a whole. The example below illustrates the concept
of goal valuation.
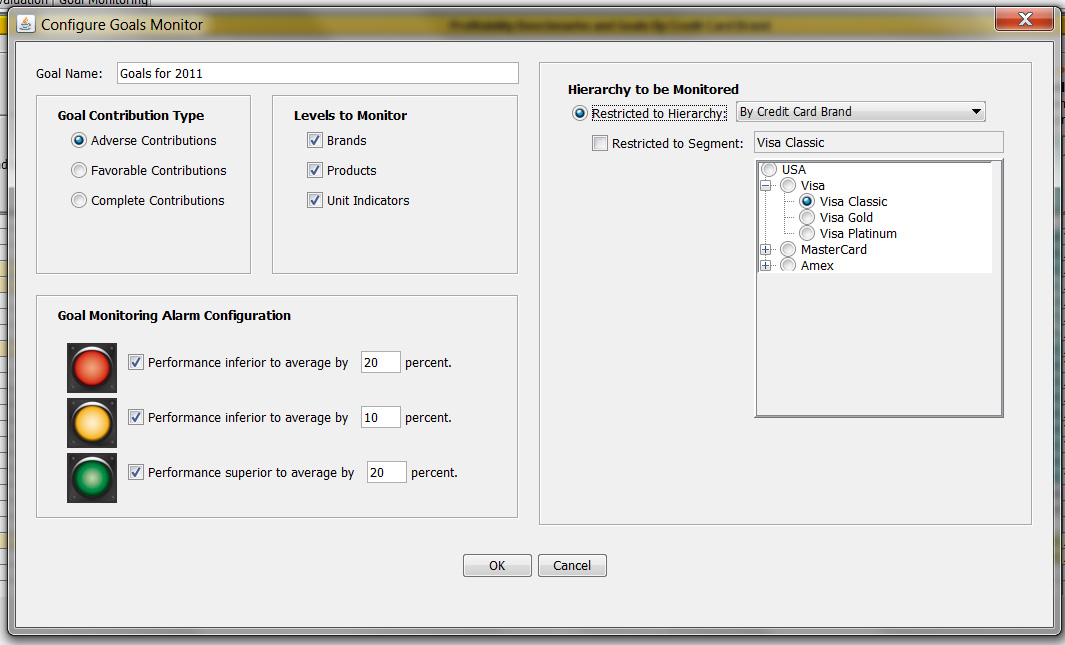
Goal Monitoring
Once these goals have been valuated and approved, these goals' progress must be monitored through the goals'
term, at any level of detail in the segment hierarchy, and for each segment or group. The fact that a given
segment may meet its assigned accumulative goal, is not an implication that its individual unit goals are exempt from
scrutiny, because some unit indicators may be outperforming their goals, thus suggesting a goal
reassessment towards better performance, while others may be drastically underperforming their goals, thus
triggering the necessary functional corrective measures to meet such goals and further improve the segment's
performance. Therefore, it is necessary that goal monitoring includes separate reviews of adverse, favorable and
complete goal contributions for each individual and accumulated goals. The following example shows the process
of goal monitoring configuration.
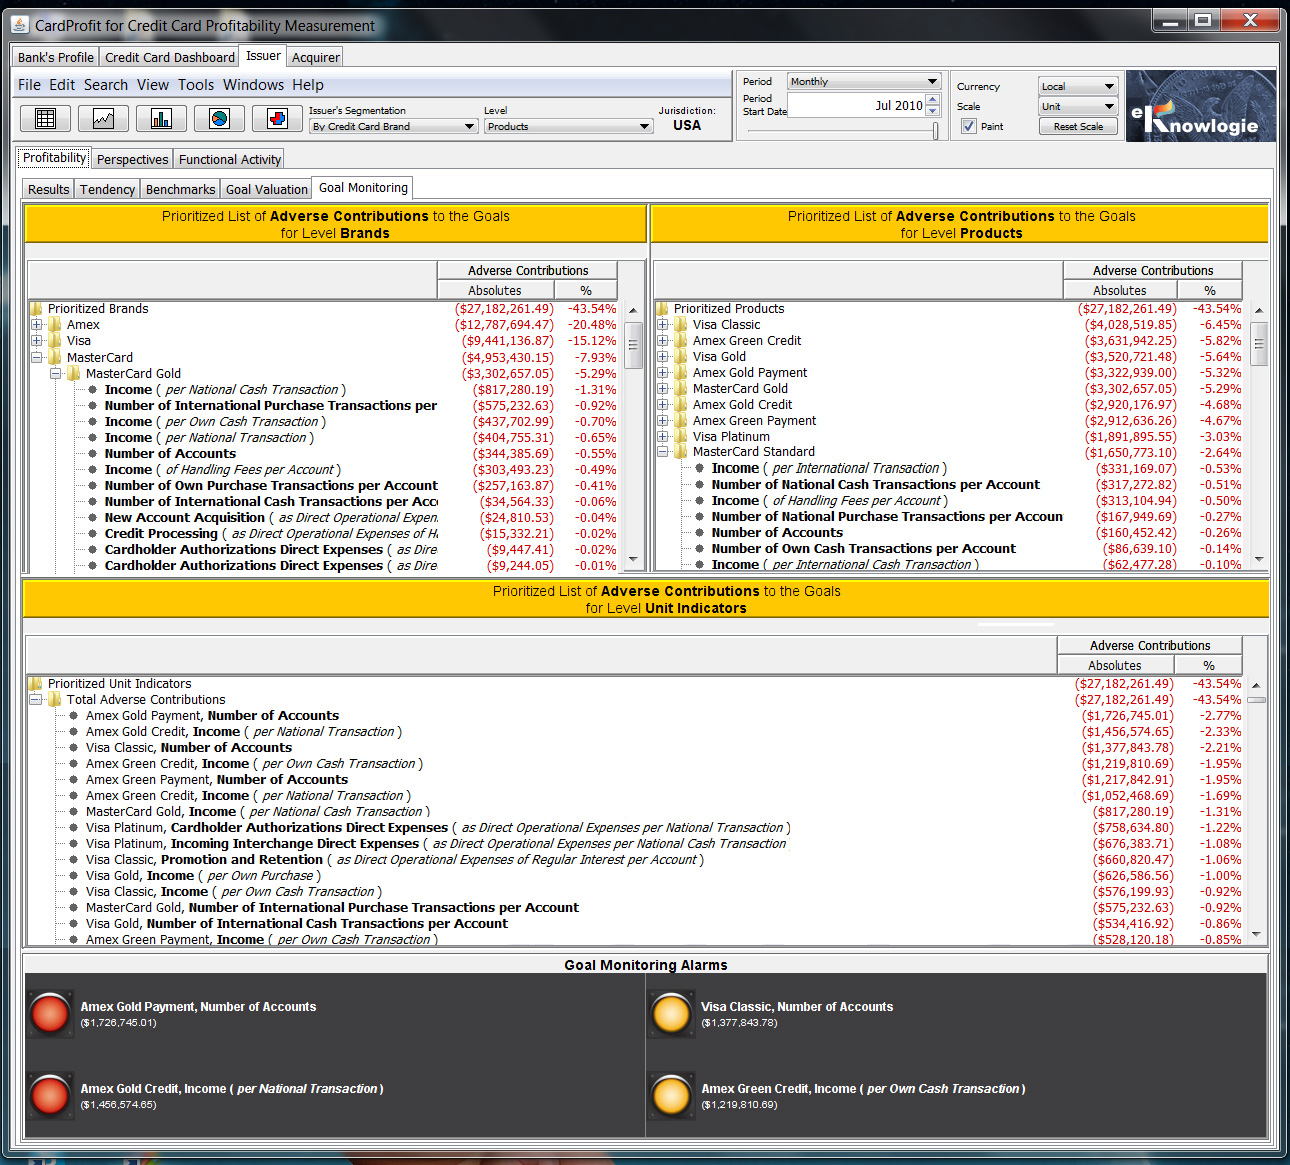
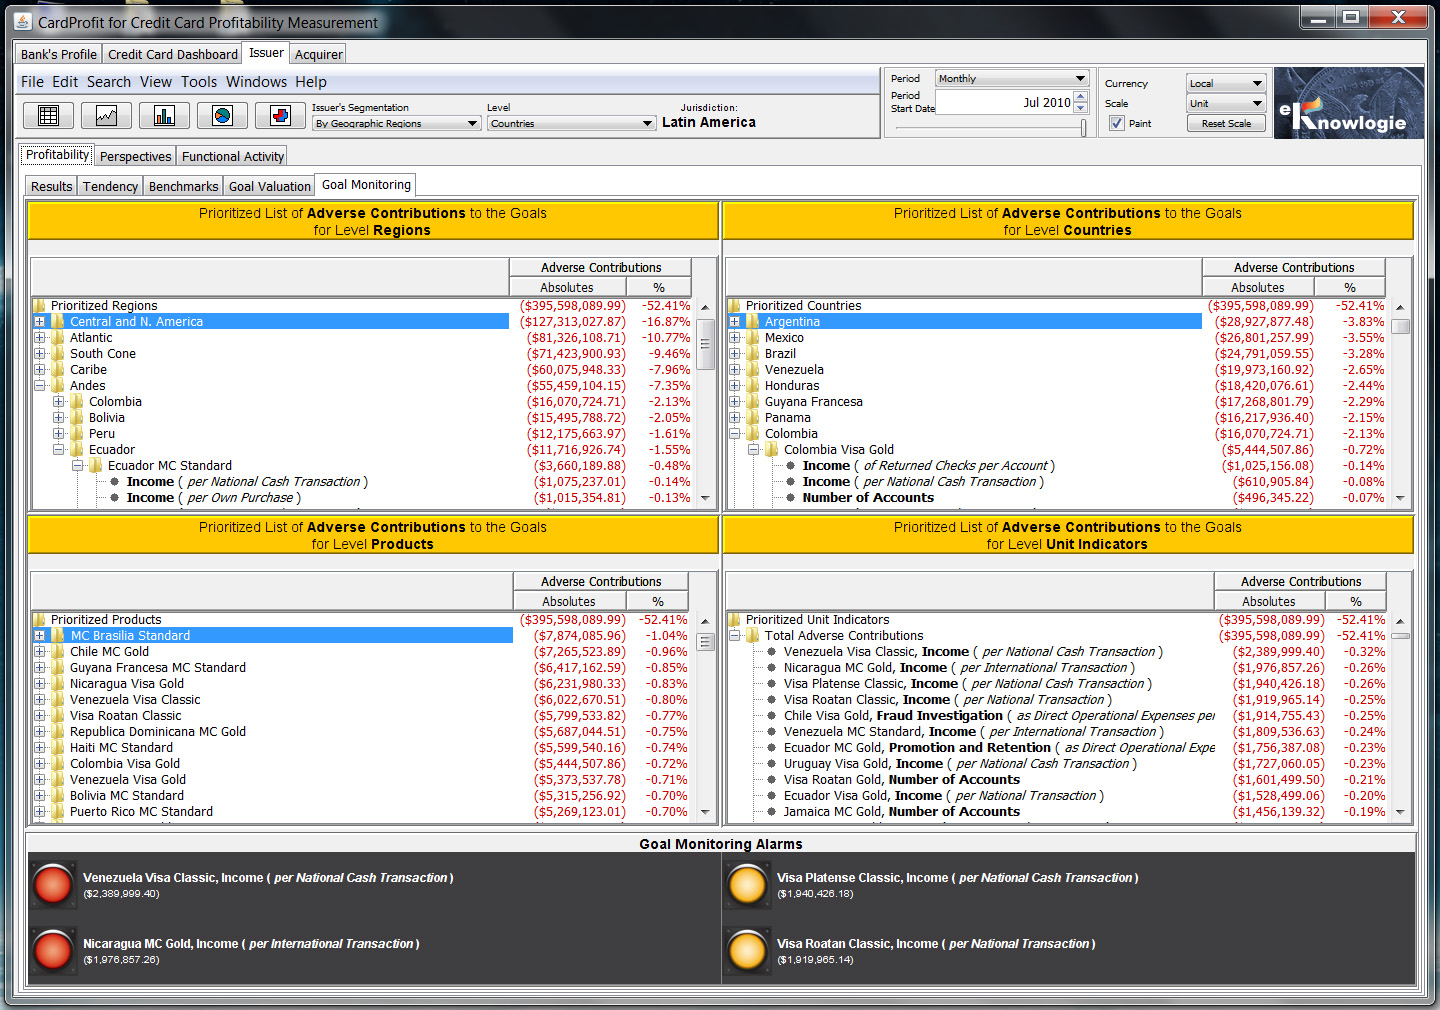
The following example shows goal monitoring for adverse contributions at all levels in the given hierarchy.
These tables are prioritized from high to low adversity and illustrate the need to produce such tables for
each level in the hierarchy. For example, even though the brand with most adverse contributions is Amex,
we can observe that the product with most adverse contributions is Visa Classic, which does not belong
to the most adverse brand. Similarly, the most adverse indicator, Amex Gold Payment, Number of Accounts,
does not belong to the most adverse product. Analysis at each level of detail encourages the use of different
corrective strategies for the management teams at each level, while providing the bank's global management with
a complete X-ray of the entire business.
A simple example of using benchmarks and goals consists of creating a historic average benchmark for all products.
With one click, all unit indicators in this benchmark can be assigned to the root of the product hierarchy, and that's it.
These goals are automatically propagated in cascade to all the products in the hierarchy. Goal progress can then be
monitored by inspecting negative goal deviation reports and alarms for the hierarchy levels, products and indicators
within products. Because we selected an average benchmark, we know that about half of the indicators will have
a performance superior to the benchmark, and thus we are not interested in positive or consolidated (positive plus negative)
deviations. We are interested in having negative deviations (below average) improve to at least the average. If
we use this strategy in consecutive years, the average will improve gradually but significantly.
The example above can be extended by assigning individual goals from different benchmarks which would override
the propagation in cascade of the average benchmark. Comparative studies to understand differences between
segments with best performance according to different benchmarks, would result in the assignment of more insightful
and beneficial goals specific to these segments.
CardProfit offers the concept of jurisdictions. The jurisdiction por each user is the level of
visualization of the model for such user. This way, users can have geographical jurisdictions which
allow each user access only to the model of the country or region relevant to that user, while at the same
time maintaining access to the global indicators and standards automatically generated by CardProfit with the
purpose of establishing anonymous performance comparisons and benchmarking. Global company executives
can of course have full access to the global model. Other jurisdictions of interest include jurisdictions
by product family brand, such that a specific brand jurisdiction could be shared with that brand's
executives, allowing other brands in the model to remain anonymous. This concept of jurisdictions is
extremely useful to multinational banks.
Multi-National Banking
Banks which offer credit card products through their newly-acquired banks or regional or country-based bank subsidiaries
may want to create a segmentation that reflects that organization, such as the one shown in the examples below
for a latin american multi-national bank. Every indicator can still be compared in depth at any of the levels in the
hierarchy for the entire bank (e.g. Regions, Countries, Products).
Goals can still be monitored throughout the entire global structure in the bank, and for all levels in the hierarchy.
Again, notice how the single indicator with the most adverse goal contribution does not belong to the product with
the most adverse contribution, which in turn does not belong to the country or region with the most adverse contribution,
thus emphasizing the need for corrective measures through proper management relationships between the levels in this
hierarchy.
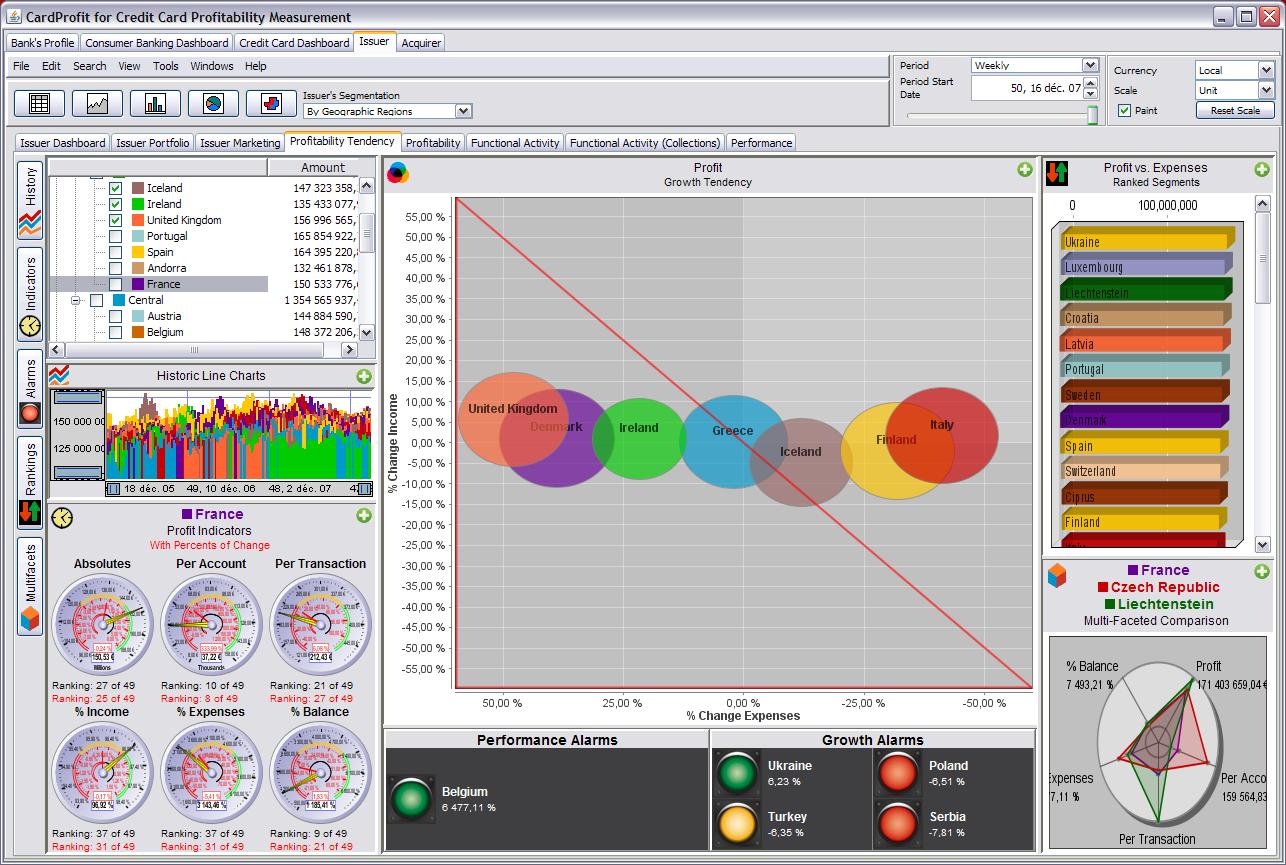
1.2 Profitability Tendency Analysis
The following example shows an Issuer profitability tendency dashboard where the profitability tendencies
can be analyzed in detail.
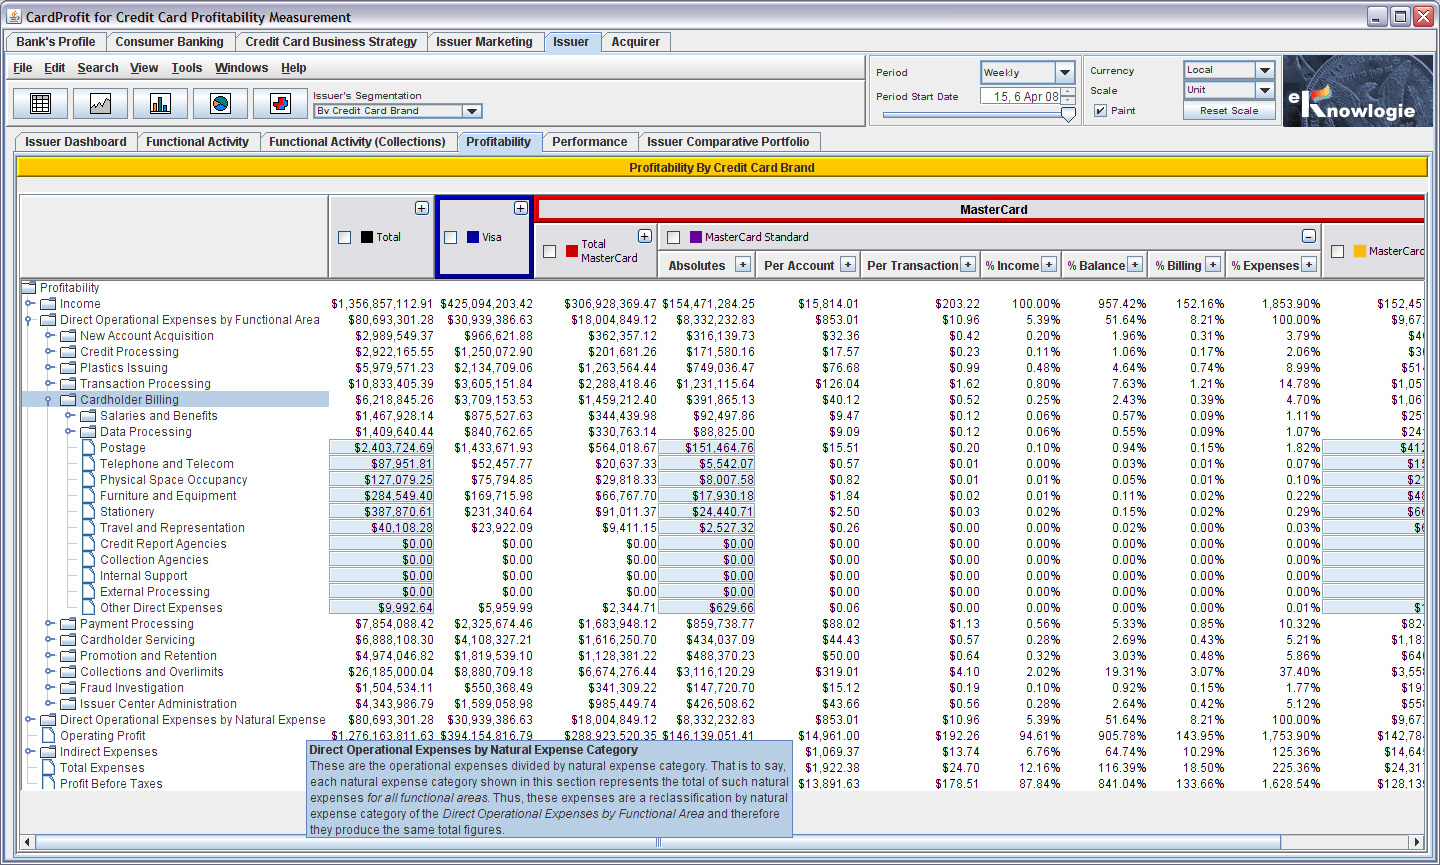
1.3 Segmented Profitability Results
The following example shows the Income Statement for the Issuer business. The hierarchy in the columns
allows visiting the chosen segmentation at any level of detail. Similarly, the hierarchy in the rows allows
visiting each Income Statement at any level of detail. This allows the use of one given table for executive
strategic purposes as well as for detailed operational purposes. Once again, the values shown in these
examples may not be realistic, simply because the data has been generated at random in order to avoid
any similarities to specific scenarios.
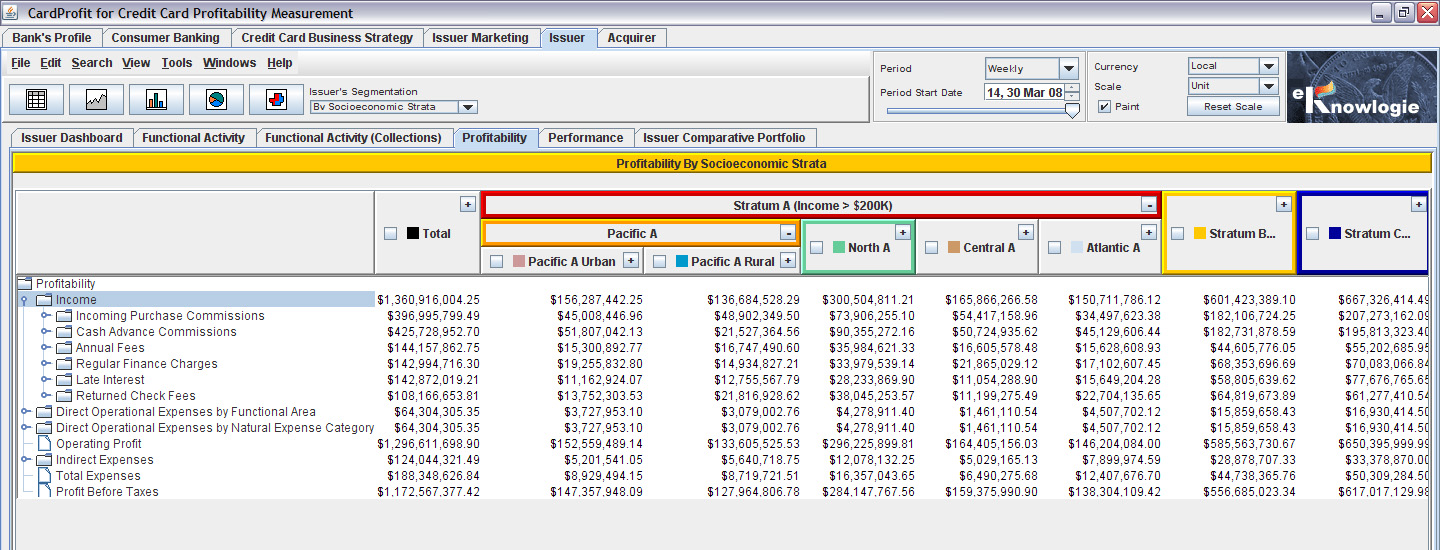
The following example shows the Income Statement for the Issuer business segmented by socioeconomic strata
cross-referenced with geographical regional segments.
1.4 Issuer's Perspectives
A line of business can be managed from different perspectives, where each offers a particular
analytical emphasis. The
main perspective supported is profitability, but other perspectives include marketing, risk-management,
CRM, and operations. CardProfit offers executive perspectives which are consolidated perspectives
across multiple lines of businesses.
CardProfit's multidimensional market segmentation is uniquely suitable for CRM analysis, because it
allows the evaluation of CRM segments from the profitability perspective. CRM tools for the credit card
and payments industry do not support profitability measurement,
rendering them unable to classify segments by their impact on the profitability of the business. This
suggests that market segmentation for profitability measurement and CRM are inseparable, given that in
order to carry out CRM impact studies on the bottom line, it is necessary that such a study be supported
with a profitability and financial performance infrastructure.
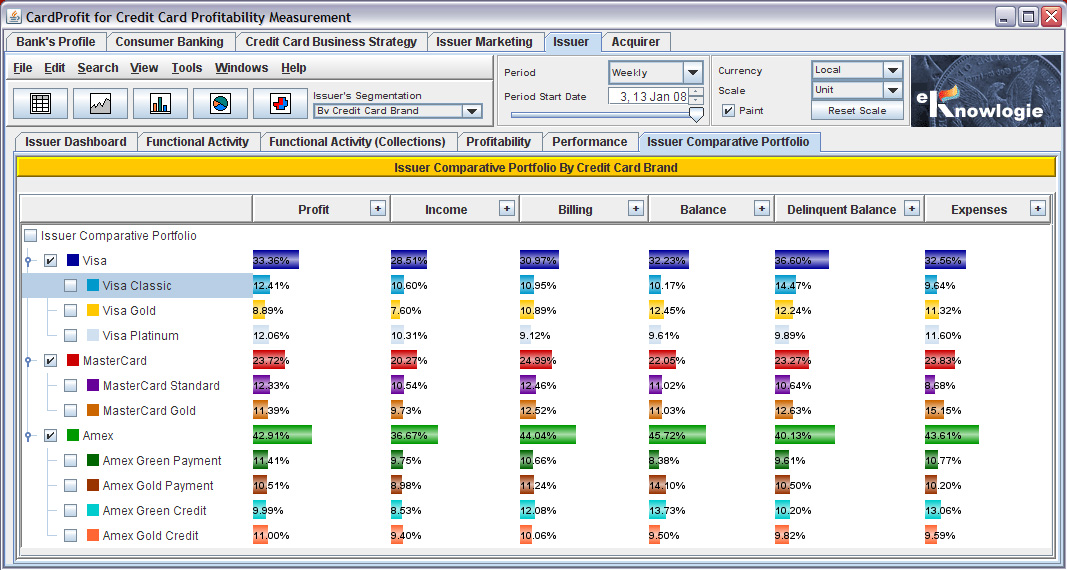
Issuer Portfolio
The following example shows a high-level view of the Issuer's consolidated portfolio segmented by
credit card brands. Notice that this is a comparative panel where the indicators are shown graphically
as percent bars. This same consolidated portfolio can be shown for any of the other Issuer segmentation
models, for example, by credit card type, by socioeconomic strata or by geographic region, etc.
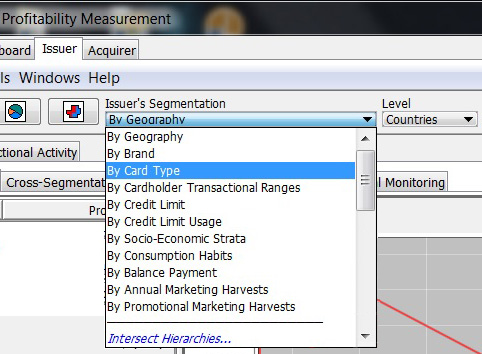
1.5 Multidimensional Segmentations and Cross-Segmentations
A market, like the Issuer market, can be segmented according to any arbitrary criteria. Issuer can
be segmented by credit card product, by geographic regions, by cardholder transactional frequency ranges,
by credit limits, by credit limit utilization, by cardholder consumption habits (if available), by
promotional campaigns, by account acquisition harvests, etc. CardProfit can be used to model a given
segmentation in order to obtain a comparative profiling and differentiation of its segments in order to
improve performance and profitability. For example, we will know via unit indicators the ways a classic
product A might be under-performing a similar classic product B.
We can also cross these segmentations in order to obtain much more revealing insights that can further
improve performance. For example, if we cross products with geographic regions and cardholder transactional
ranges, we could discover that high transactor cardholders in a product Visa Gold in geographic region A are
outperforming the high transactors for the same product in socio-economically similar geographic region B.
Cross-segmentation can also allow us to differentiate delinquent cardholders according to the acquisition
harvest or marketing campaign to which they belong. This allows us to answer numerous questions which we
could not answer if we viewed every single segmentation separately. Then we can find out, for example,
what percent of travelling cardholders pay their balance in full or revolving or become delinquent and
further subdivide these segments by geographical regions. The example to the right shows a menu with
some possible Issuer segmentations. Only the segmentation by product and product brand is required for
Issuer. Other segmentations are optional.
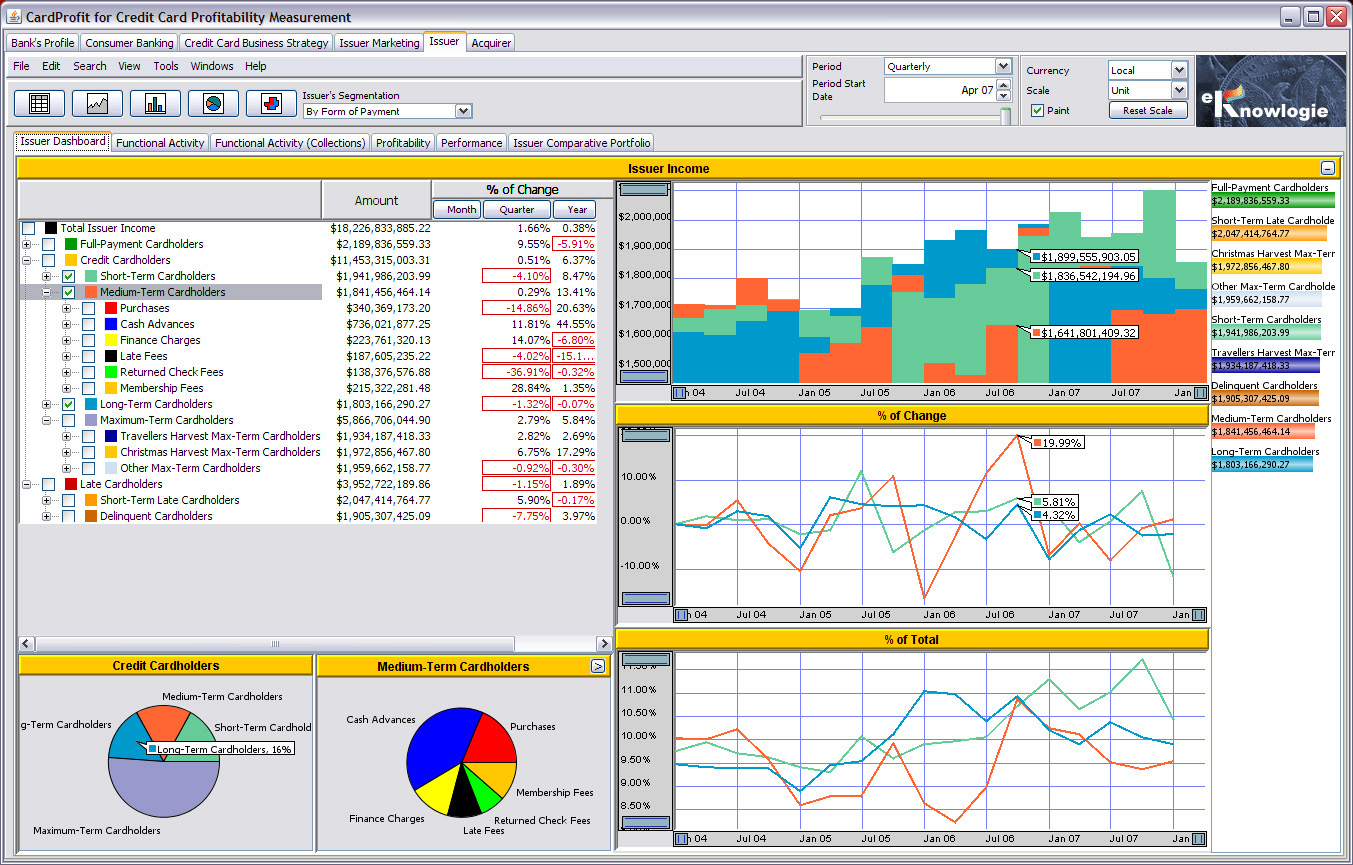
The following example shows the Issuer Income for the Forms of Payment segmentation. Notice how the
maximum-term cardholders segment (i.e. card holders that extend their credit by making only the minimum
monthly payments) is cross-referenced by the marketing campaign harvests. These market segmentations
allow us to analyze the campaigns' effectiveness in selecting new credit-oriented cardholders with low
incidence of delinquency.
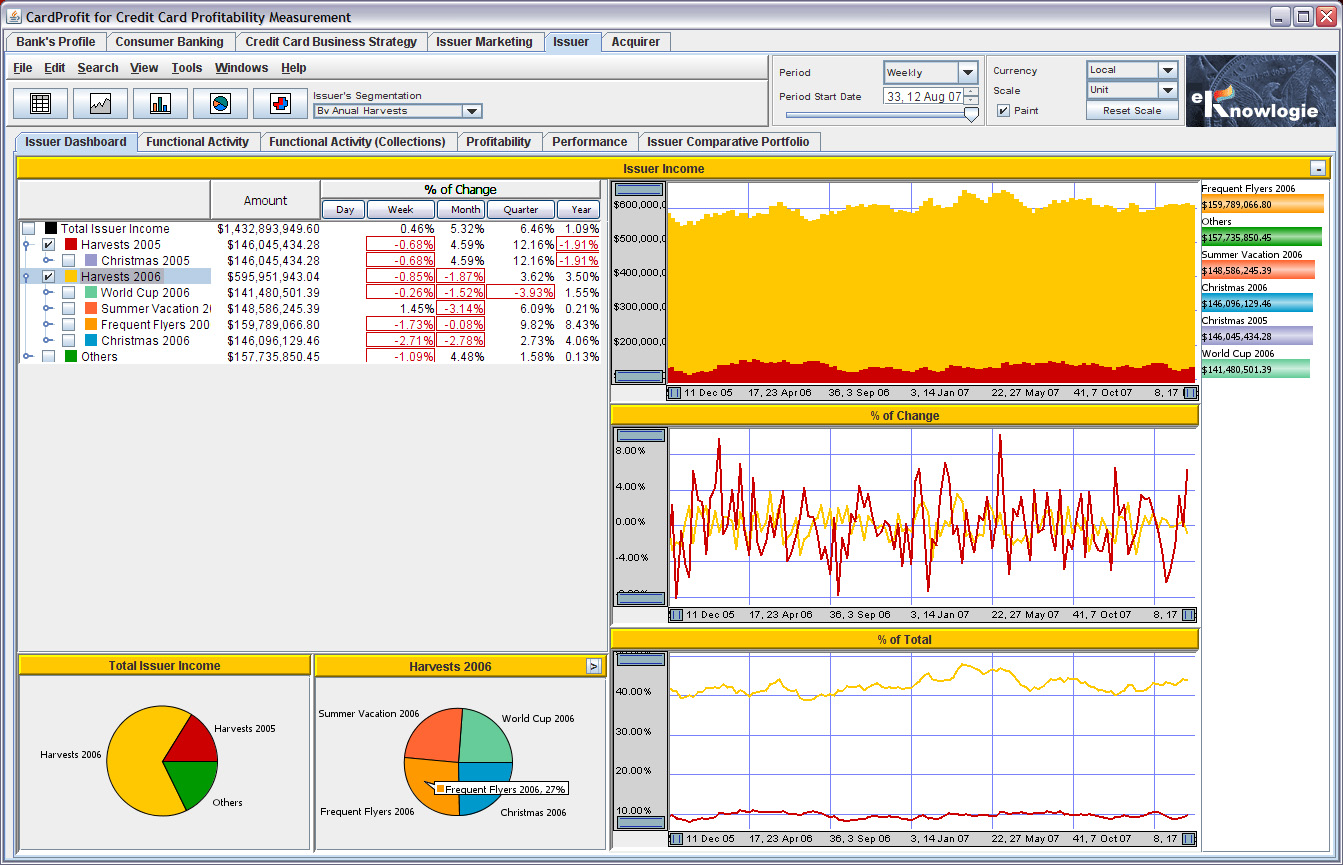
The example below shows the Issuer Income for the Marketing Campaign Harvests segmentation, using
a hierarchy that classifies them by type of promotional campaign.
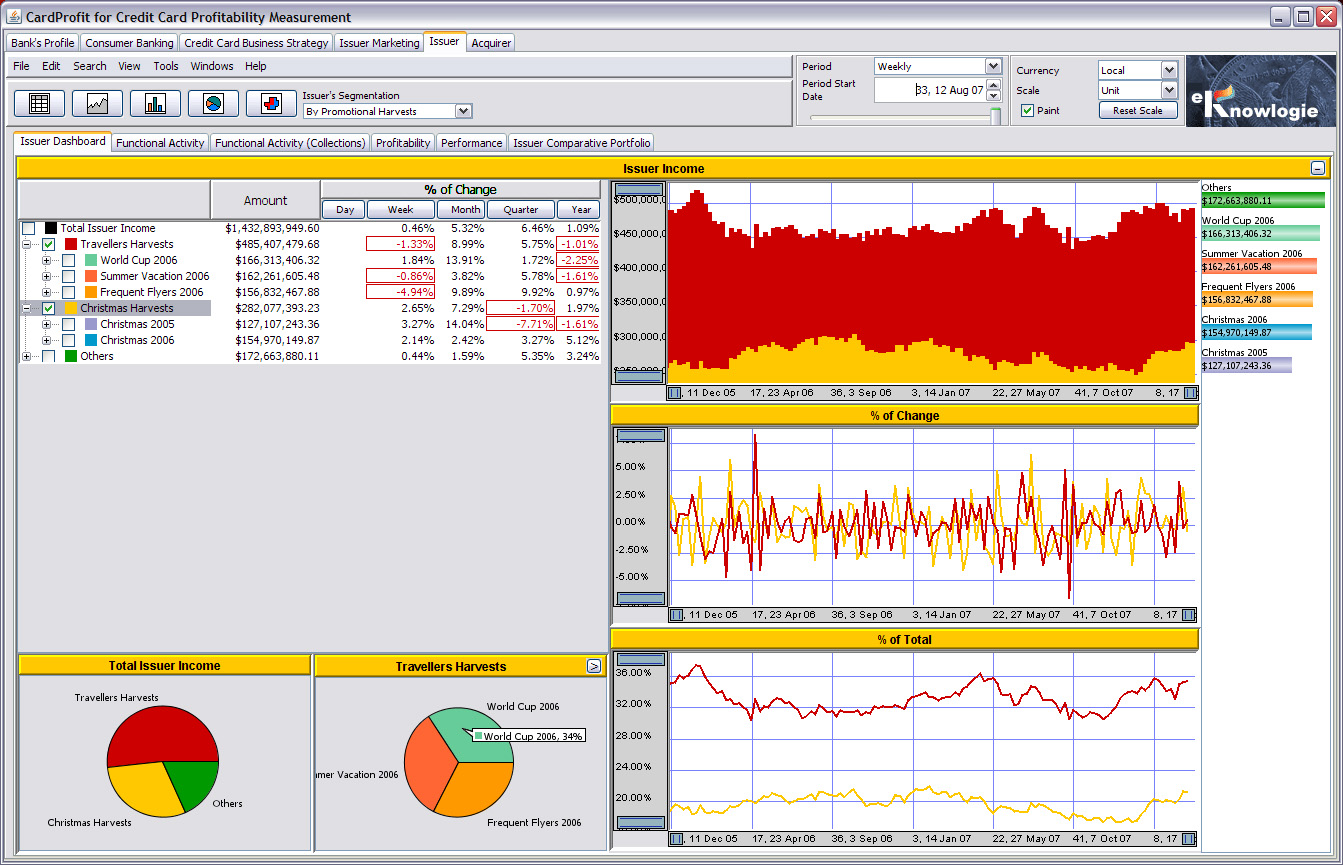
The following example shows the Issuer Income also for the same Marketing Campaign Harvests segmentation,
but this time using a hierarchy that classifies these segments according to their launch calendar periods. In
CardProfit, each segmentation can be classified according to multiple hierarchies.
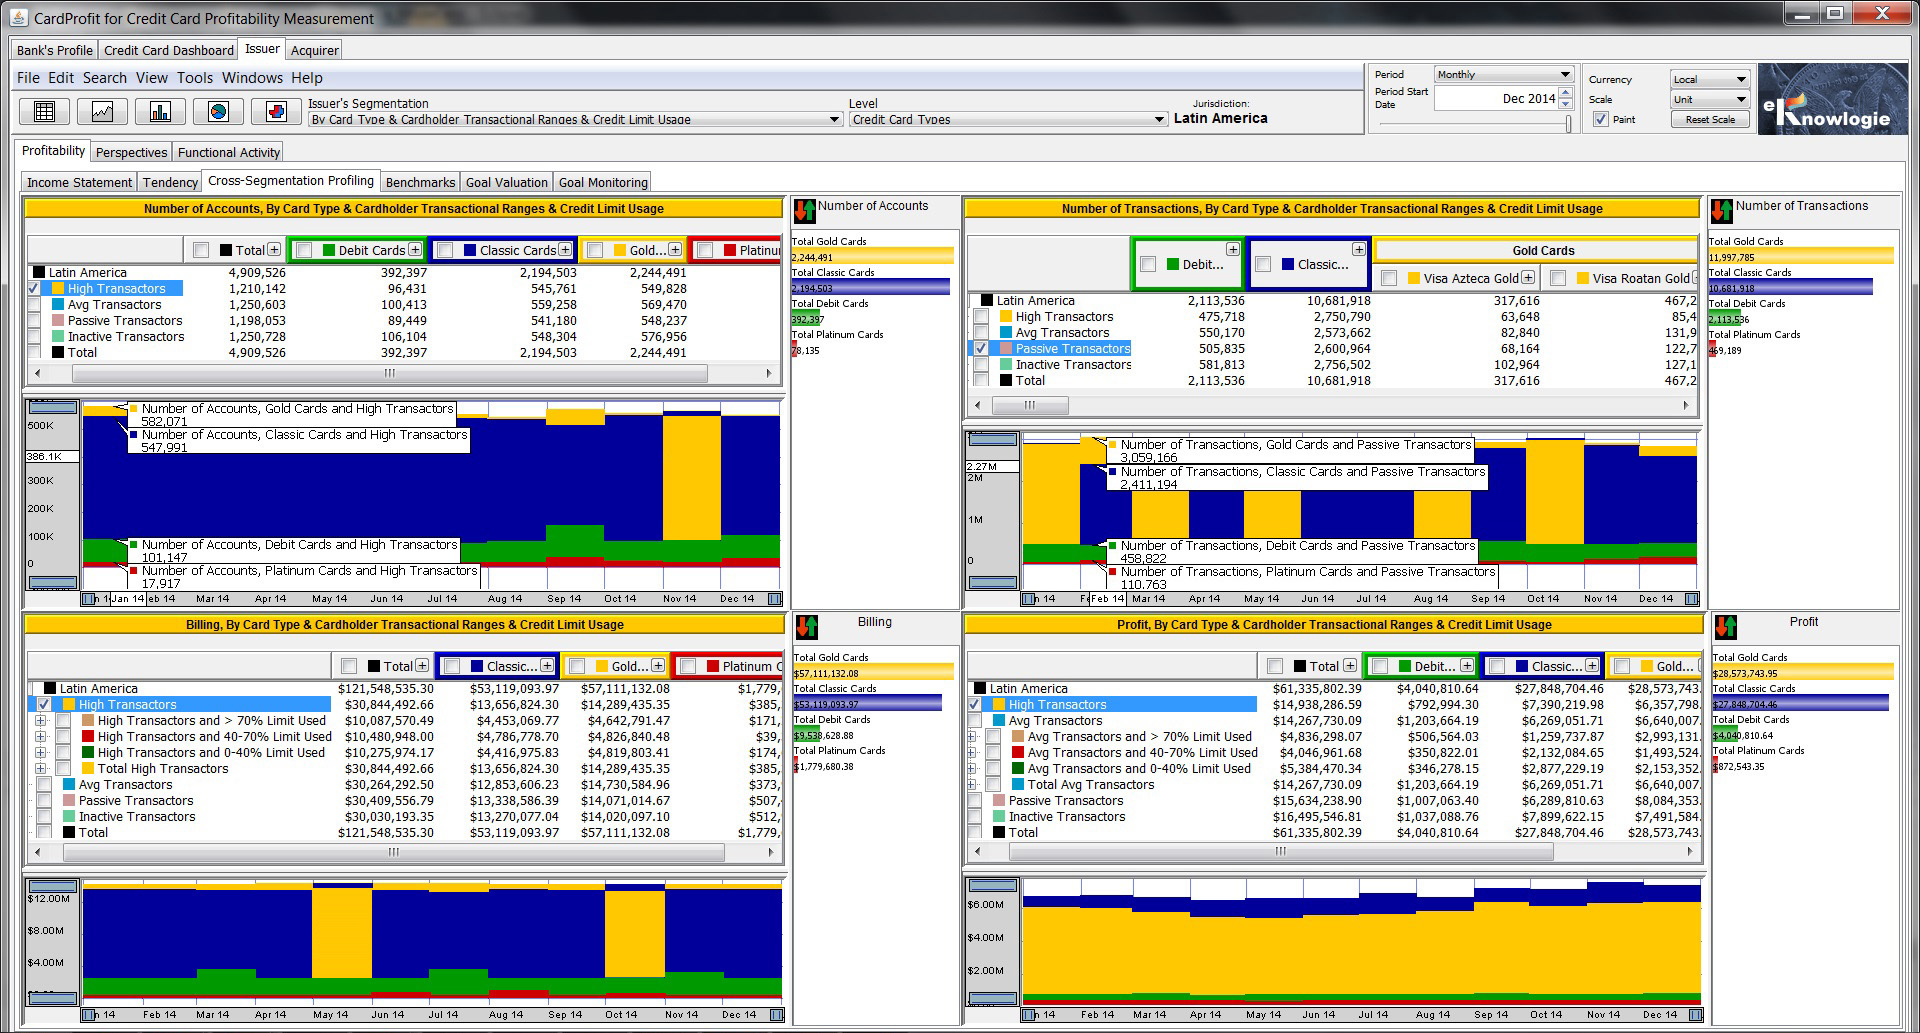
Intersecting or Crossing Credit Cards by Type with Cardholders by Transactional Frequency Ranges
Product types (e.g. classic, gold, platinum) can be profiled by the expected percentage of cardholders
in different transactional volume ranges (e.g. high transactors are cardholders who use the given card
for most of their transactions and they contribute the majority of the transactional volume for that given
product). The panel below shows the intersection or crossing of three segmentations, by product type,
by cardholder transactional ranges, and by credit limit usage. Then we can readily identify how effective
these products are in maximizing transactional volume according to their intended markets, and what cardholder
population redistributions are necessary in order to increase these volumes towards the expected profiles.
Because of the hierarchical nature of these tables, card type columns such as classic and gold can be
opened up so that specific products can be analyzed. Similarly, ranking bars can be shown for any level
in the intersection, e.g. by card types, by card types per cardholder transactional type, or by product
per cardholder transactional type. This hierarchical level management is conducive to the presentation
of detailed insights which illustrate the comparative essence of these product populations and leads to
informed recommendations and decision making. Again, figures in the example below are random and do not
reflect the realistic expectations of these segment intersections.
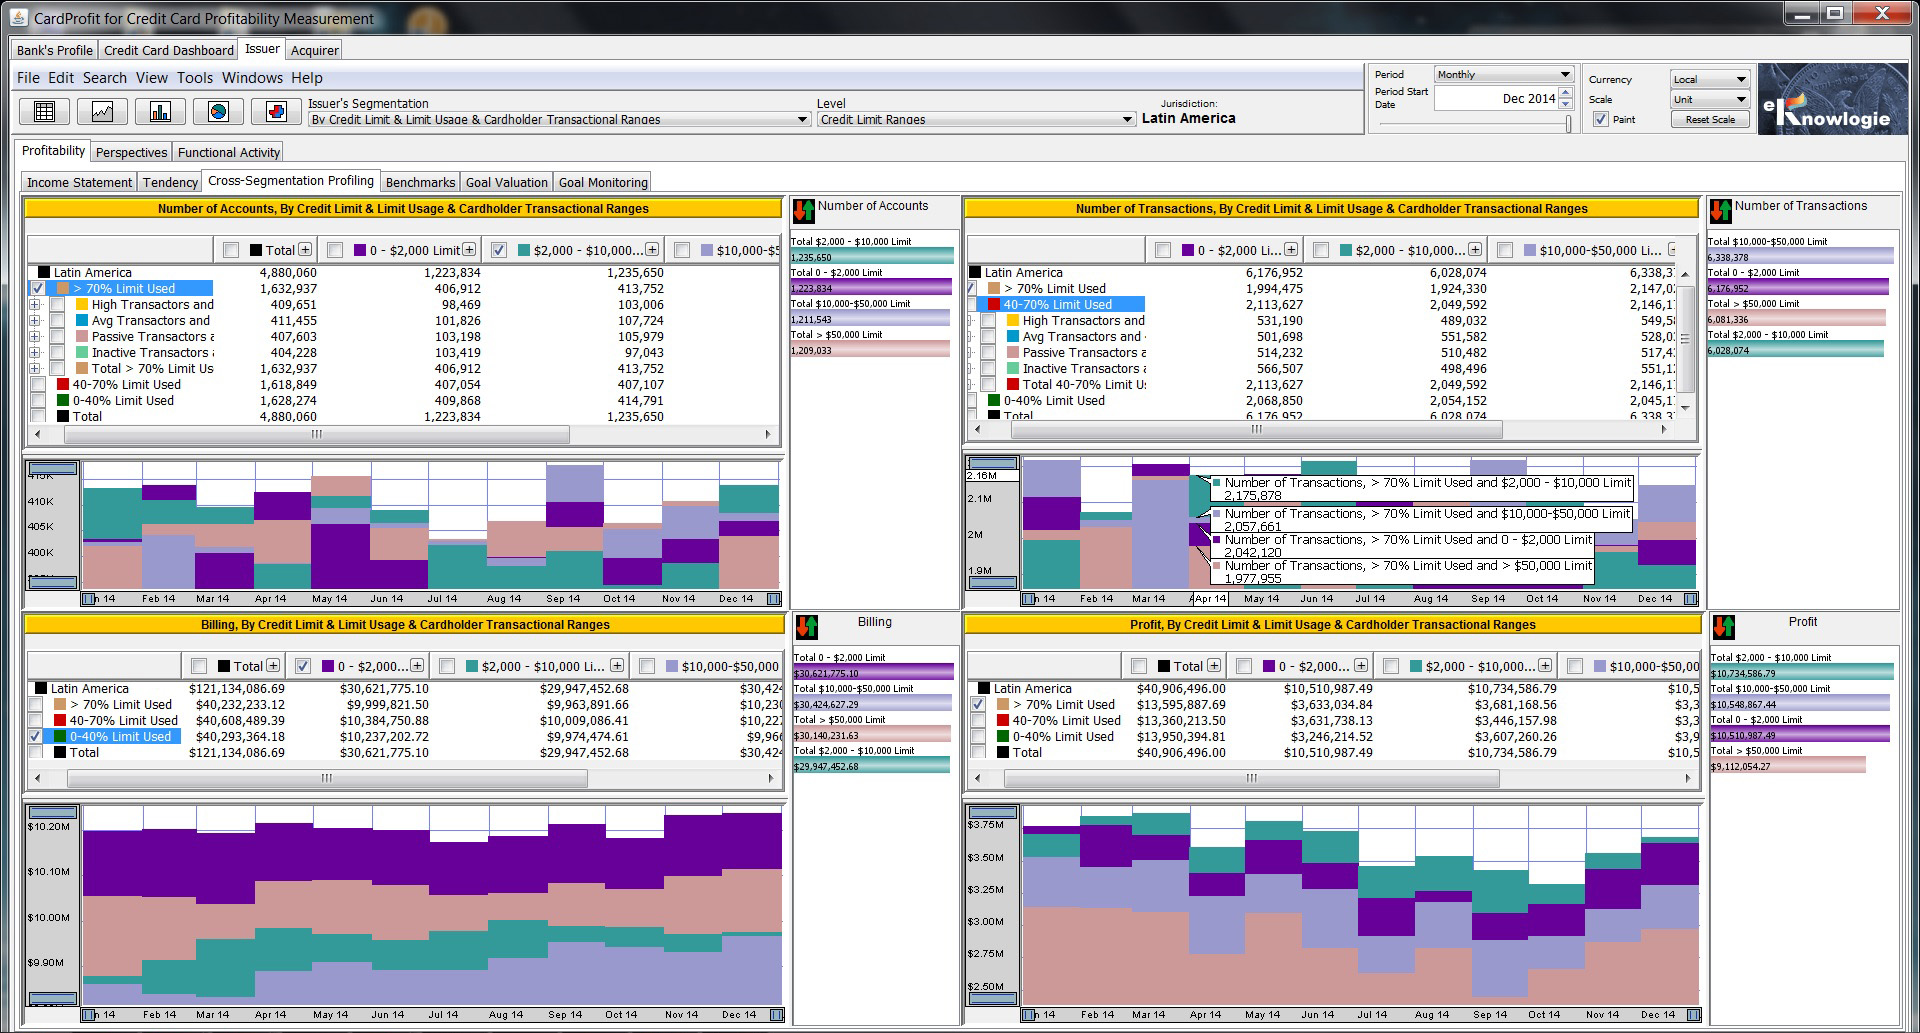
In addition, other market segmentations such as cardholders by balance and credit limit utilization
can be used to make these redistribution recommendations by identifying opportunities to retarget these
cardholder populations. The panel below shows the intersection or crossing of three segmentations,
by credit limit, by credit limit usage and by cardholder transactional ranges.
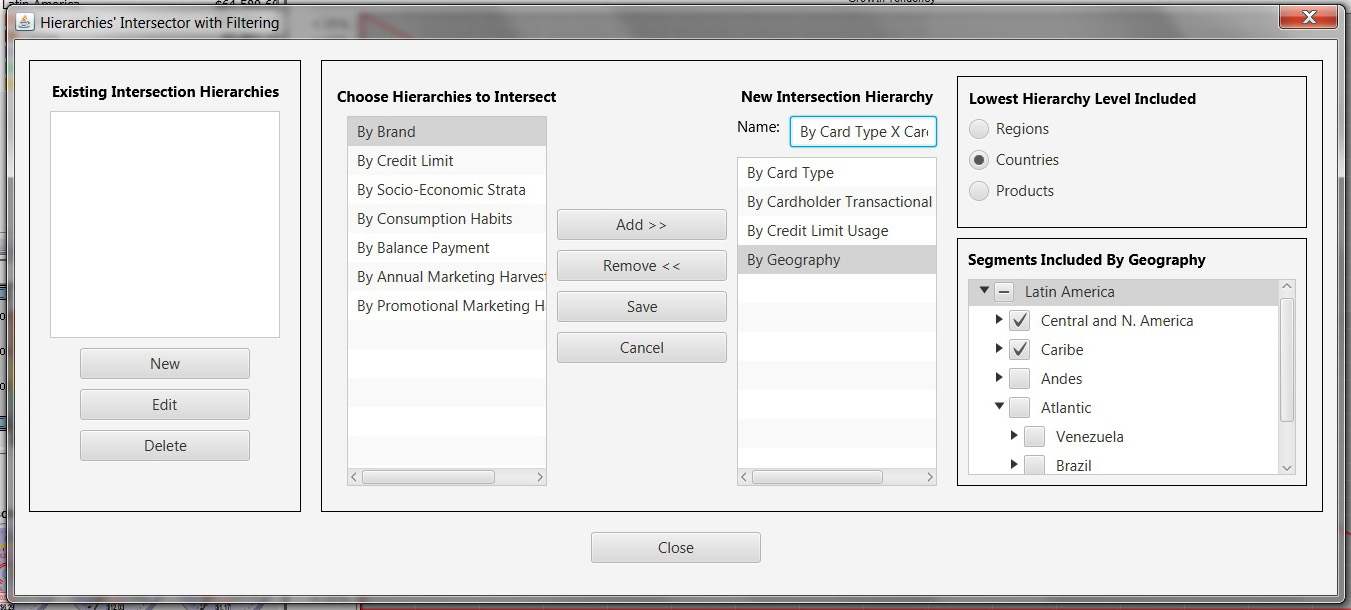
These segmentation crossings or intersections shown above are designed and configured by the user
interactively using the panel below. This panel allows the user to cross or intersect any number of
segmentations, in any order, and to specify the levels and segments that will be visible for each
segmentation. This is an example of the power of this technology.
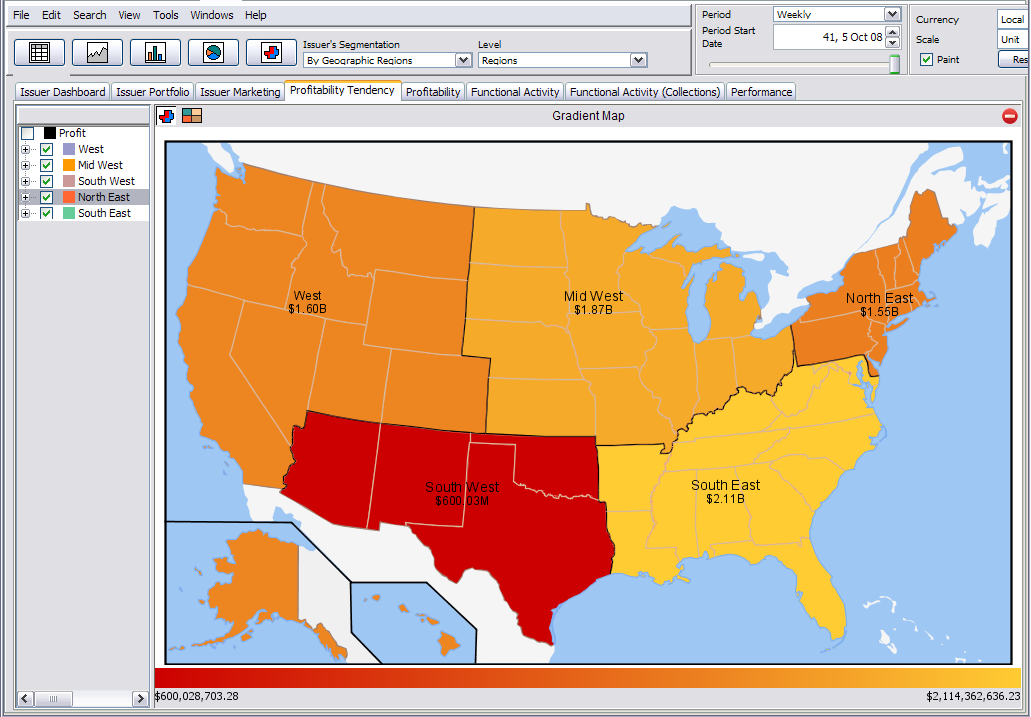
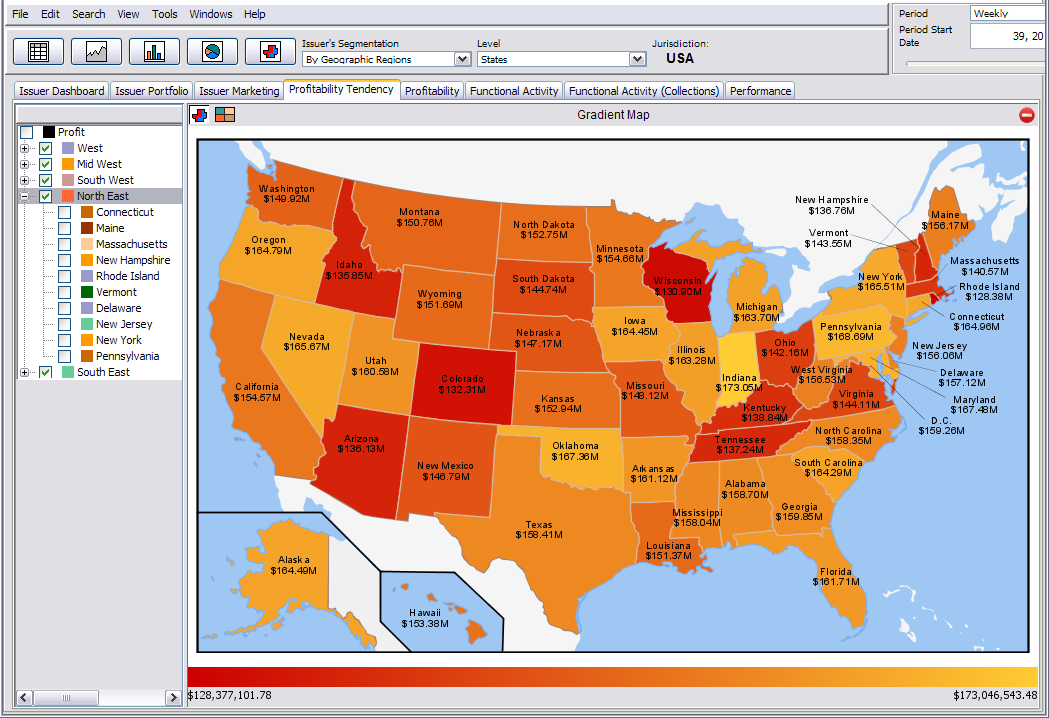
1.6 Geographic Visualization
The panels below show CardProfit's scalable choropleth maps (color-coded statistical maps) displaying
profitability indicators segmented geographically, where performance is visualized in a chromatic scale
from red (lowest performance) to yellow (highest performance). As shown below, geographical segmentations
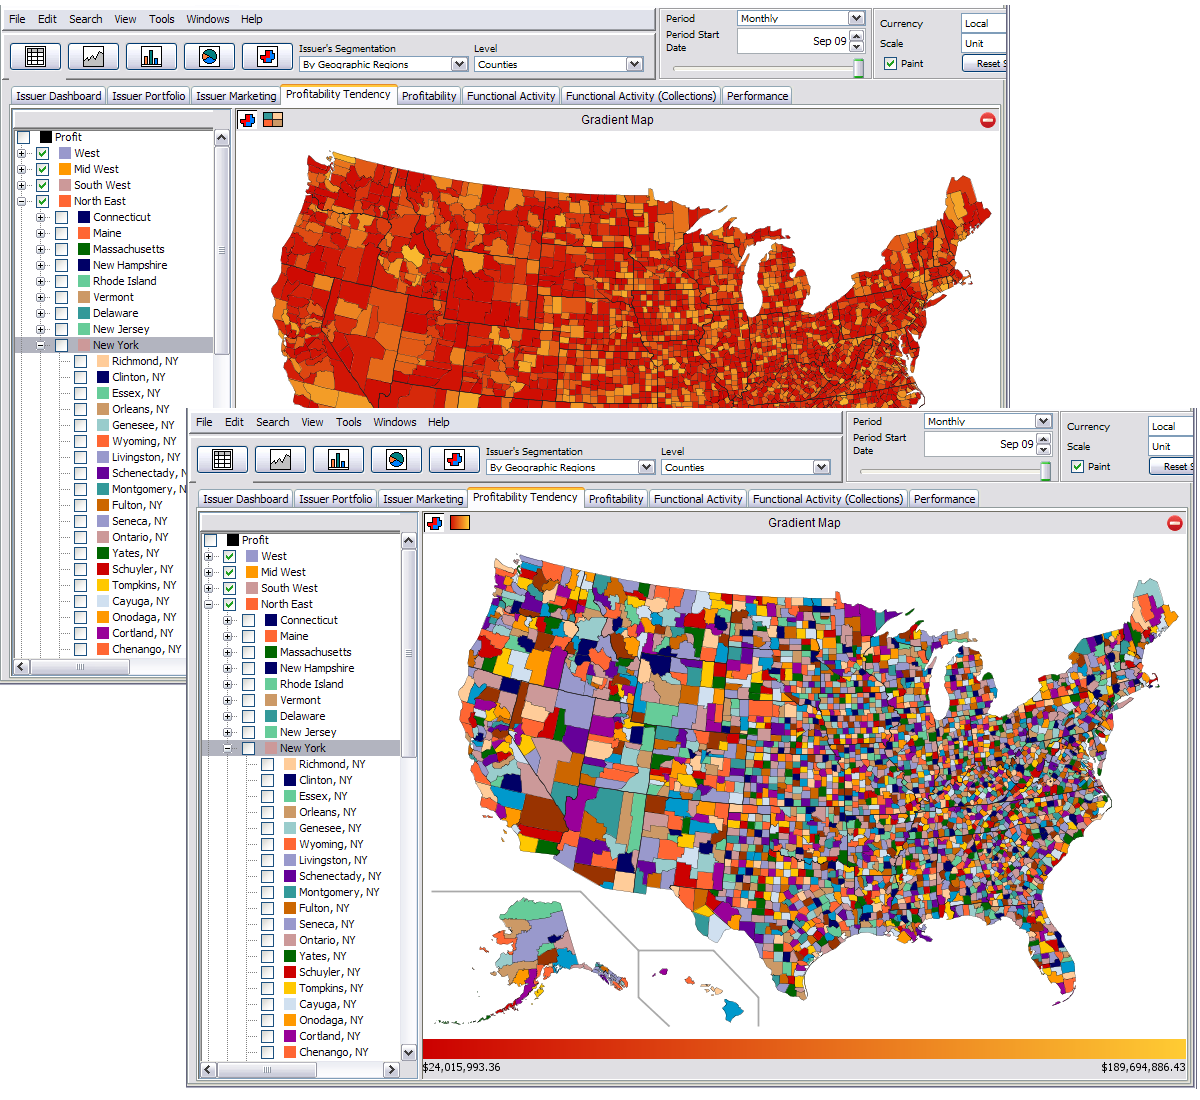
can be visualized at their various hierarchical levels of detail.
Maps can also be used for color encodings other than gradient performance.
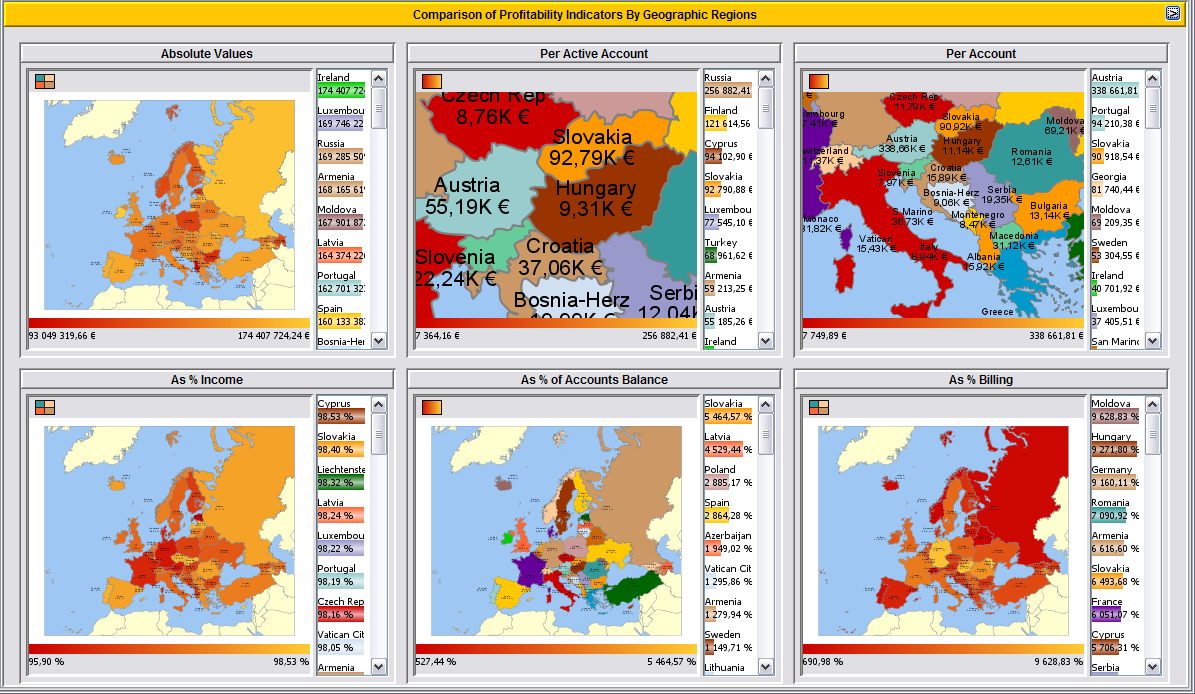
Profitability can be measured through a wide array of indicators as shown by the thumbnails in the following
example.
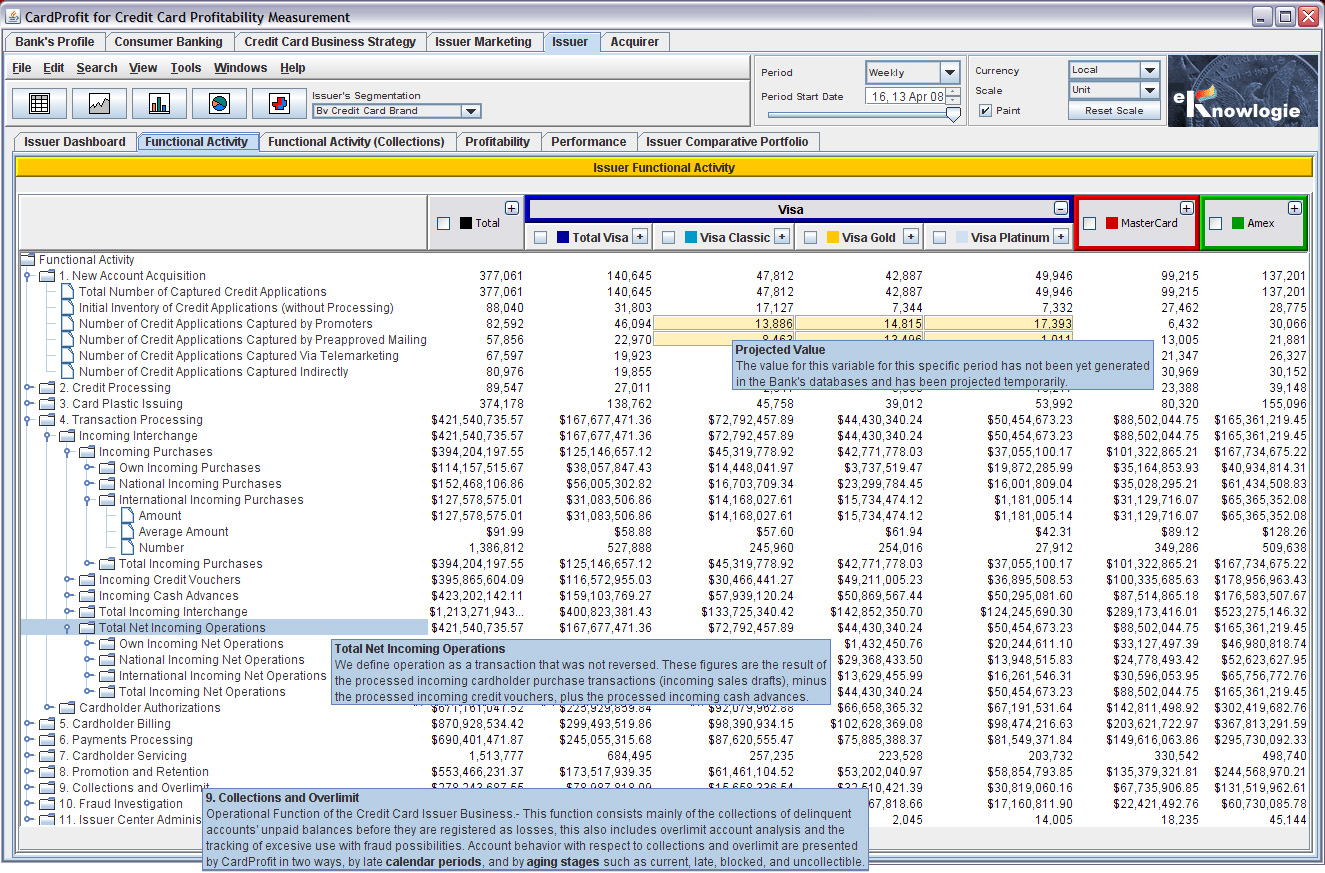
1.7 Issuer's Functional Activity
The following example shows in detail the indicators and variables of the Issuer's functional activity
segmented by credit card brand. Observe how the pop-up help window explains the "Collections and Overdraft"
category. These pop-up help windows exist not only to explain CardProfit functionality, but also to describe
each of the more than 1,100 indicators in the credit card business.
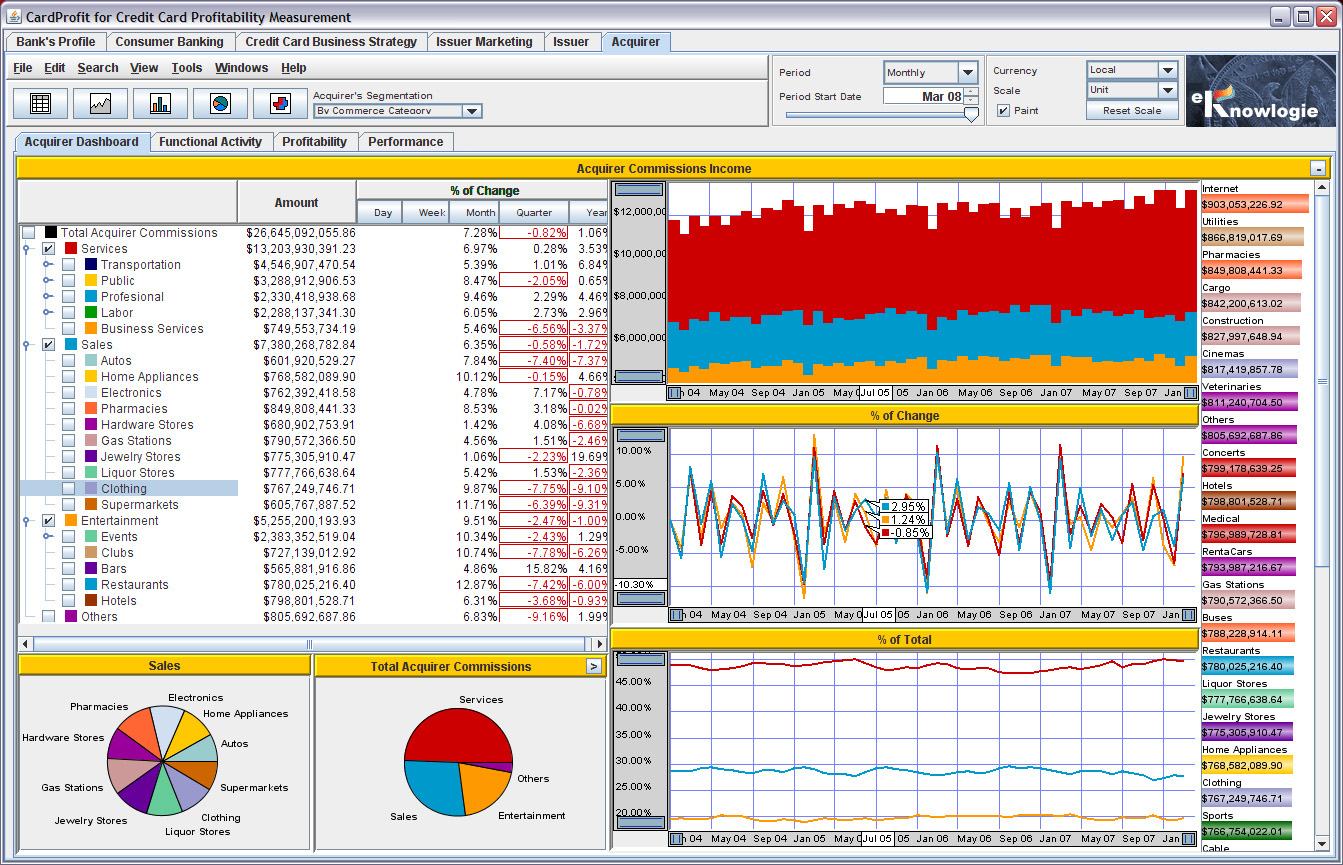
2 Acquirer
All the CardProfit functionality shown for Issuer is also applicable to Acquirer. The example
below shows the study page of the Acquirer Income, using a monthly period. Notice that
commerce categories are shown ranked by their income for the currently selected period.
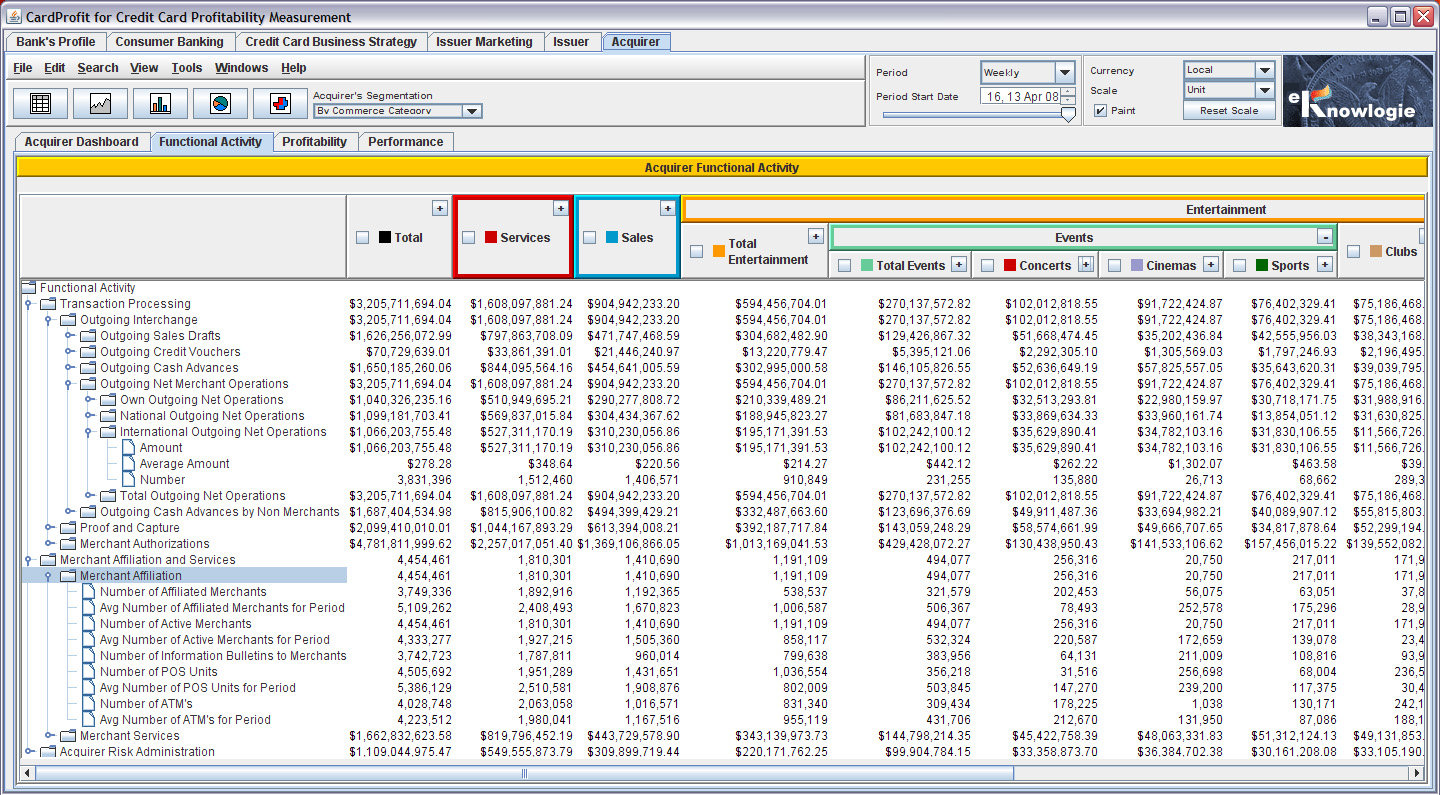
The example below shows the Acquirer business' functional and operational activity for each commerce
category.
3 Combined Issuer and Acquirer
With respect to the credit card Issuer and Acquirer lines of businesses, CardProfit manages more than 1,100
different primary variables which are specific to such businesses. CardProfit can be started effectively with
25 variables from each business line and gradually extended as justified by the added benefit of additional
measurements. CardProfit produces profitability and performance indicators by product or by any other
arbitrary user-defined market segments, as well as operational figures and indicators of natural expenses
and productivity specific to the functional areas of the Issuer and Acquirer businesses.
Each variable or unit indicator in the model can be visualized historically and through time periods
of any duration.CardProfit can be configured for any currency and world
region or locale. Although initially configured for English and Spanish, it can be easily configured
for any other language. eKnowlogie based its Issuer and Acquirer profitability models on the methodologies
developed by Global Payments, the banking consulting company with an exclusive emphasis on
credit card profitability and the most prominent in Latin America.
CardProfit offers consolidated combined perspectives for multiple lines of businesses. The following dashboard
shows combined Issuer and Acquirer profitability tendencies. The indicators represented in this bubble chart are
normalized, which permits the comparison of otherwise heterogeneous segments from both lines of businesses. Notice
that the values in these examples have been generated randomly and thus they are not realistic.
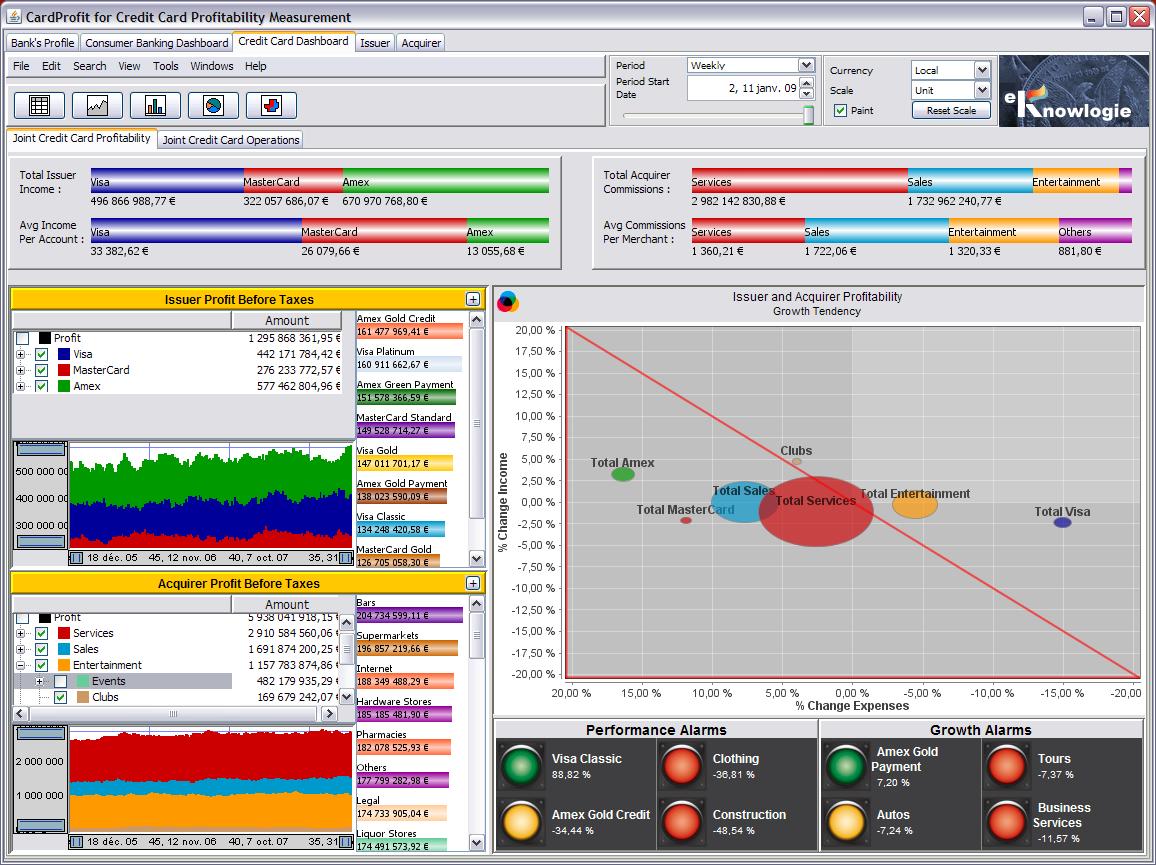
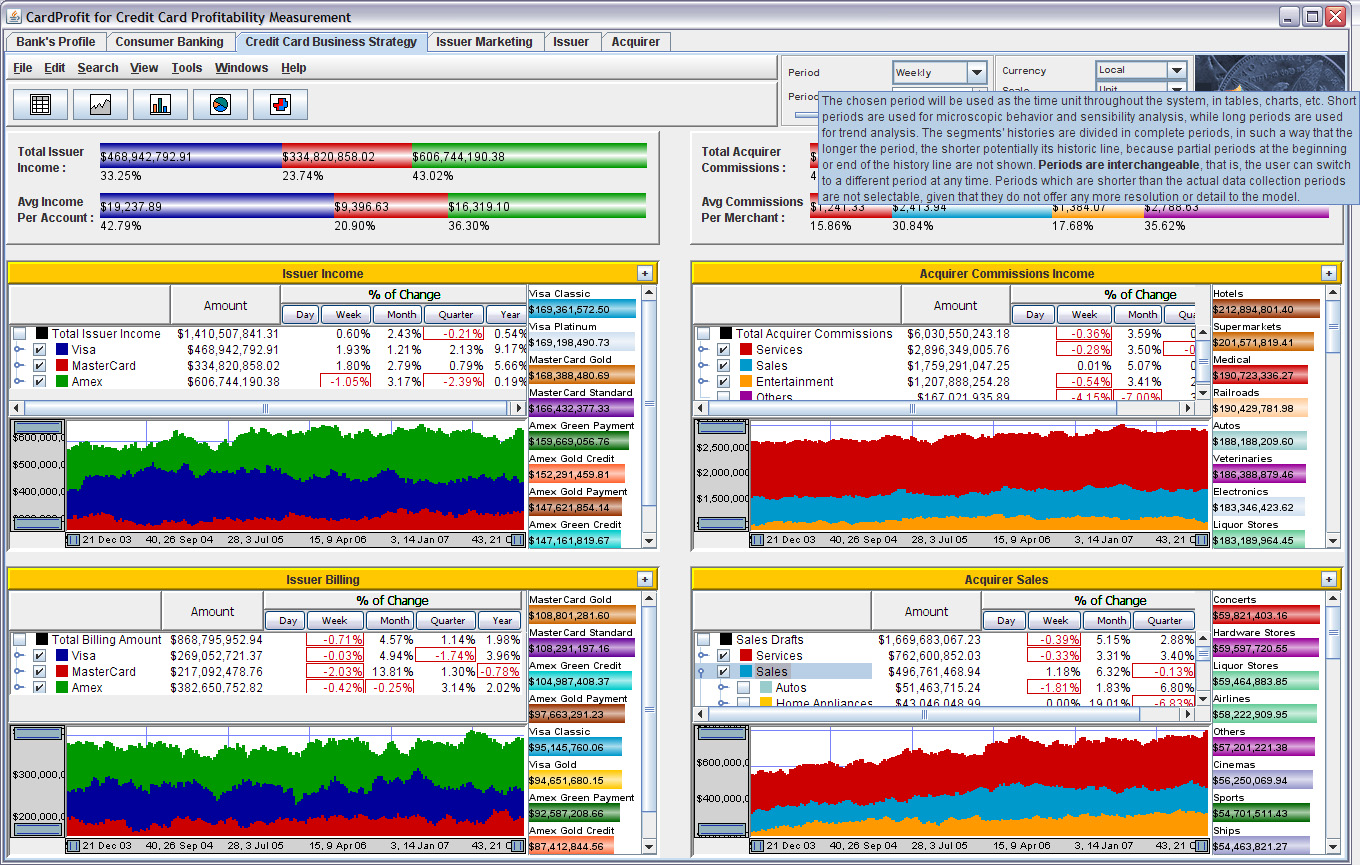
The following example shows another dashboard for the Issuer and Acquirer businesses. Each mini panel can be
maximized in order to visualize it in more detail and with additional instrumentation. Notice one of the many
pop-up help windows, which in this case describes the use of time periods throughout the application.
4 Client's Running Environment
CardProfit runs in 64 bit Windows 7 or 8 with preferred access to high-definition screens (1920 X 1080).
CardProfit makes use of multi-processor architectures for parallel execution of computation-intensive calculations.